The SEO and content marketing world shares a lot of data about blog traffic, but there isn’t a ton of publicly available data about the difference in conversion rate of different search terms or what typical or average SEO conversion rates are for different search terms.
Since we’ve built our brand on prioritizing high buying-intent keywords, and we measure conversions from every piece of content we create, we thought it would be interesting and useful to the content marketing and SEO community to report on the conversion metrics of different types of bottom-of-funnel SEO keywords.
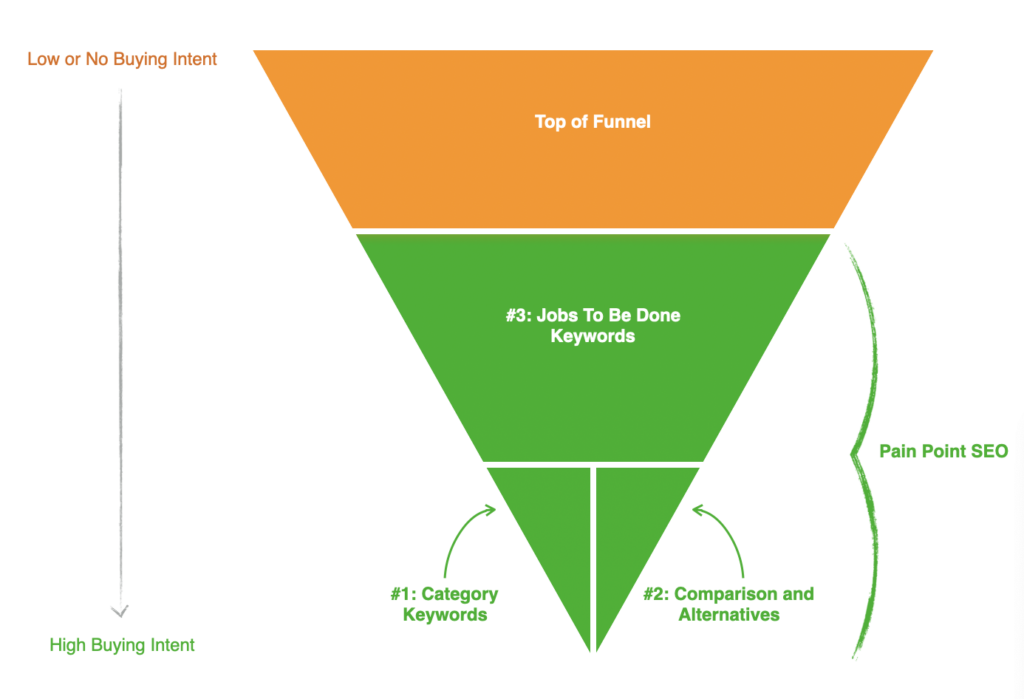
As explained in Pain Point SEO, we think of high buying-intent keywords as being in one of three categories:
- Category Keywords
- Comparison and Alternative Keywords
- Jobs To Be Done keywords
To do this study, we pulled six months of data from 95 articles we wrote for our clients, each ranking for a different primary keyword. In total, these 95 articles got over 123,000 organic pageviews in the period analyzed and 4687 product-related conversions (meaning free trial starts, demo requests, or sales form fills).
Below, we compare the conversion rates of articles ranking for SEO keywords in the three categories above. Our post explains how and why the conversion rates are what they are (and how to use this information for your benefit).
Note: If you want to know what we mean by ‘SEO conversion rate’, how to calculate it, and more, jump down to our FAQ section.
Overall Results: How Well Different Bottom-of-Funnel Keywords Convert
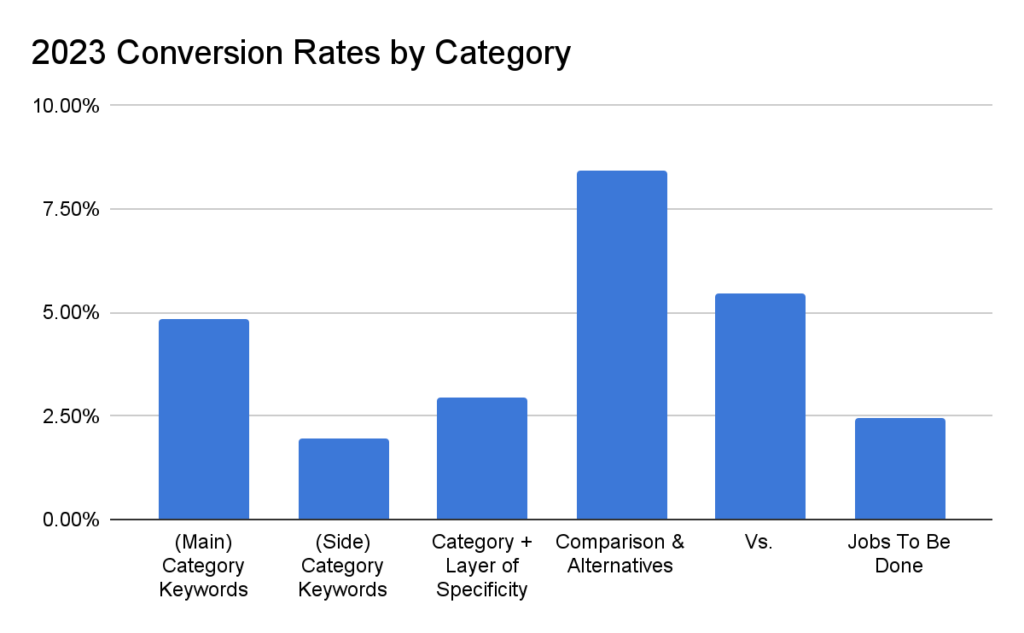
Here are the types (and sub-types) of keywords we analyzed and their conversion rates:
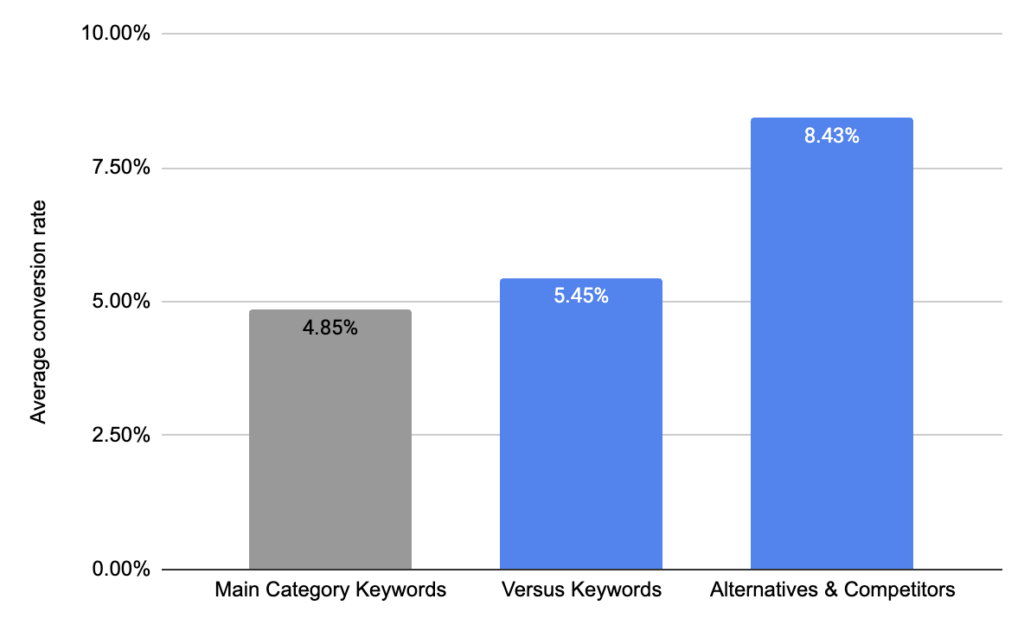
1. Category Keywords
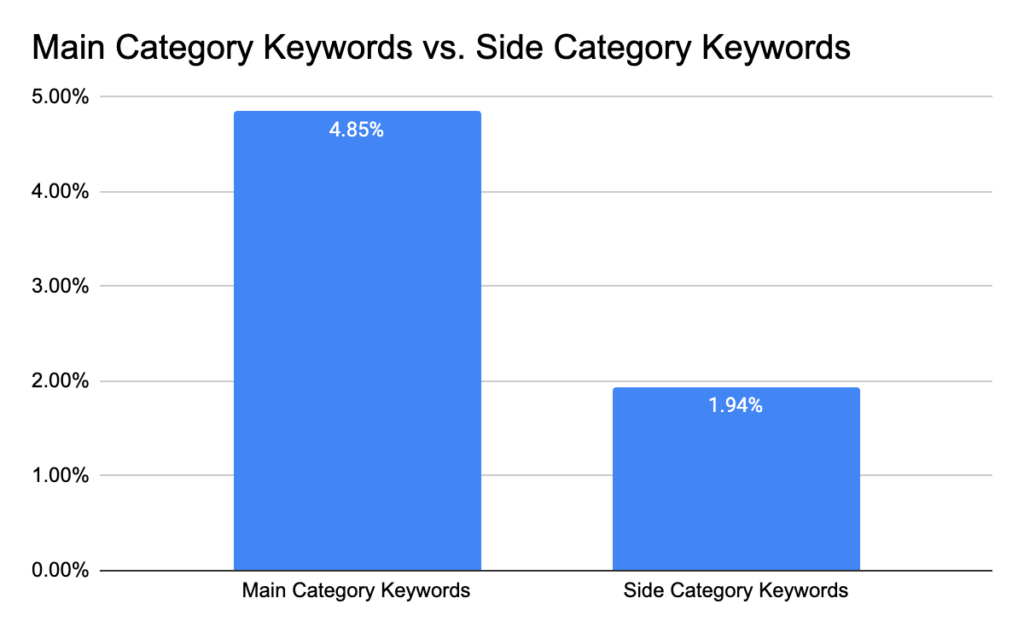
- [Main] Category Keywords: Queries that describe exactly what you offer (4.85% average conversion rate)
- [Side] Category Keywords: Queries that show buying intent for a secondary feature or use case (1.94%)
- Category + Layer of Specificity: Queries that imply the searcher is looking for a product like yours but for a specific use case or vertical (2.96%)
2. Alternatives + Competitors
- Queries that mention competitor names, indicating Googlers are aware of other brands in your industry, searching for alternatives, and could be good candidates for your solution
- These had the highest average conversion rate (8.43%)
- “Vs.” Keywords: Queries comparing two solutions —
[Brand #1] vs. [Brand #2] — (5.45%)
3. JTBD Keywords
- Queries that describe jobs to be done — or problems to be solved — that you offer the absolute best solution for (2.44%)
We’ll discuss each type of keyword and its average conversion rate below.
Main Category Keywords Are Your Brand’s Bread and Butter
4.85% average conversion rate
These are the queries that describe exactly what you offer — i.e., the person searching is shopping for the type of products or services you offer. This includes keywords like “best accounting software” or “men’s running shoes.” If you sell accounting software or men’s running shoes, these are keywords you absolutely want to be ranking for.
We expect the conversion rate of keywords with this much buying intent to be high, and it is. Most people don’t expect blog posts to convert at multiple percentage points, much less 4.85%, but this data shows that they can when they rank for the right keywords and are written to sell the product.
That’s why we have long advised that brands prioritize these keywords, and this data further supports that assertion. For example, Geekbot — a solution to run online standup meetings (full case study here), and a past client of ours — ranks #2 for “Slack standup bot” via a post we wrote for them, and that single long-form blog post has a lifetime conversion rate of 8.36%.
In addition, we ranked a video marketing client on page one for multiple terms around their video marketing sub-category; the app, software, and service variations of those keywords convert at 5.73%, 3.31%, and 3.00%, respectively.
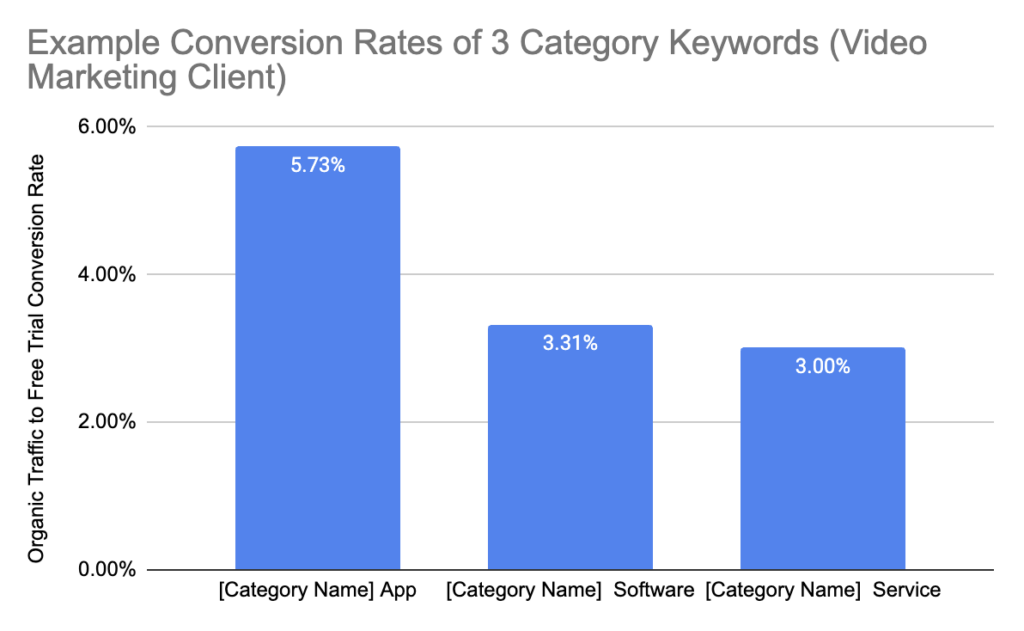
Importantly, the takeaway here is not that app keywords convert higher than software and service keywords!
In this case, it just so happens that the post ranking for an “app” keyword converted at the highest rate. Still, the takeaway is simply that when you target variations of product keywords and cover all of your bases, you should expect most variations to convert well (i.e., at 3% or higher to free trial starts) because Googlers are researching products similar to yours.
Now, with that said, if you only offer an app or only offer a service, you may find certain category keywords simply don’t fit your offerings, so all category keywords may not convert as well for you.
But in general, category keywords consistently convert for all of our clients; specifically, we see these conversion rates (3–5%, or even higher, like in the case of Geekbot) routinely for main category keywords.
This reinforces the advice we’ve given many times: Every company investing in SEO should start by identifying their main category keywords and very intentionally crafting dedicated pages on their site to rank for them.
Category Keywords Around Side Offerings Have a Lower Conversion Rate (But Are Still Valuable)
1.94% average conversion rate
Many companies release new features or services and want to build content to promote those offerings. While that’s fine, this study taught us that these keywords don’t usually convert as well as keywords related to your core offering (aka your main category keywords).
This could be for various reasons: perhaps that side offering just isn’t very strong, or it’s a part of your solution that can’t be used or purchased separately, or the side offering is too expensive compared to other brands. It could also be that the rest of the marketing site simply doesn’t sell the side offering as much as the main features, so it naturally converts less.
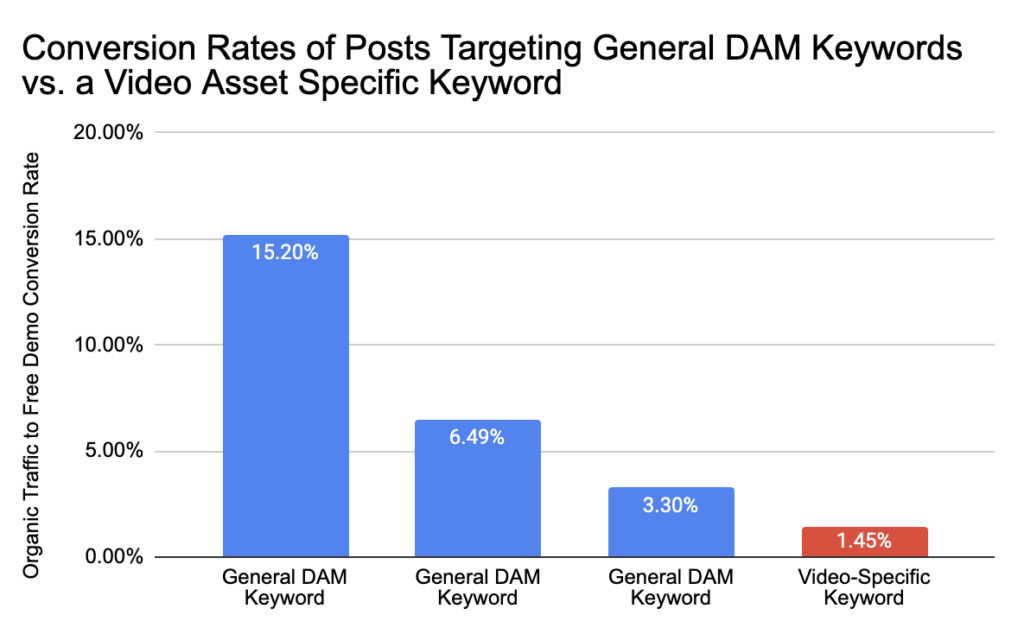
For example, one of our clients sells digital asset management (DAM) software, a common software category for many businesses with creative assets. One of the creative assets you could store in a DAM is videos. One of the posts we wrote for them targeted a keyword around storing video assets and it converts at 1.45%.
That’s still a good conversion rate, and far higher than most brands’ typical TOF content, which converts at a tiny fraction of a percent. But we have several posts for this same client that target general digital asset management type keywords. Those are converting at 3%, 6%, and even 15%!
We think the low conversion rate of the video-specific keyword is because users who only need a video asset solution could opt for something simpler than full digital asset management (DAM) software, whereas users who need to store all kinds of digital assets, not just videos, need a general-purpose DAM.
This reinforces our core Pain Point SEO message: The #1 thing dictating your conversion rate is the search intent of the person searching and how well the query aligns with what your product does.
Our next observations further support this.
Category Keywords with Added Layers of Specificity Are Hidden Gem Keywords That Most Brands Miss
2.77% average conversion rate
An additional flavor of category keywords are those that add a word or two that make them more specific to a particular feature, use case, or customer type. For example, adding “for small business” to the end of the keyword “best accounting tools,” or adding “for trail running” to the end of “men’s running shoes.”
We’d expect these “added layer of specificity” category keywords to convert really well because you’re targeting searchers who (1) already have some knowledge of the category, and (2) are searching for a very particular solution (what you offer).
The data in this study does confirm this, but with some important nuances and caveats.
Going back to our digital asset management example: this client markets their DAM to support professionals across all different industries (manufacturing, education, healthcare, real estate, eCommerce, etc.), but as you’d expect, their primary audience is marketers and creative professionals because that’s who stores the most digital assets (product images, etc.). And our client happened to have extra features designed for those users, specifically. So we targeted “marketing asset management software” and saw a whopping 15.2% conversion rate from that post!
So we do see several “layer of specificity” category keywords convert even higher than 4.85%, which is the average standard category keyword conversion rate discussed above.
But why is it that most “layer of specificity” keywords don’t convert that high, and the average is only 2.77%?
We think these keywords are simply a game of taking bets where you have to guess which specific keyword variants will “hit” with your target audience and your product, and the reality is that most will not hit, you’ll have plenty of misses. But when you do get a hit (like “marketing digital asset management software,” above) it can convert incredibly well.
Here are the conversion rates of 13 posts for different clients that target various “specific” category keywords:
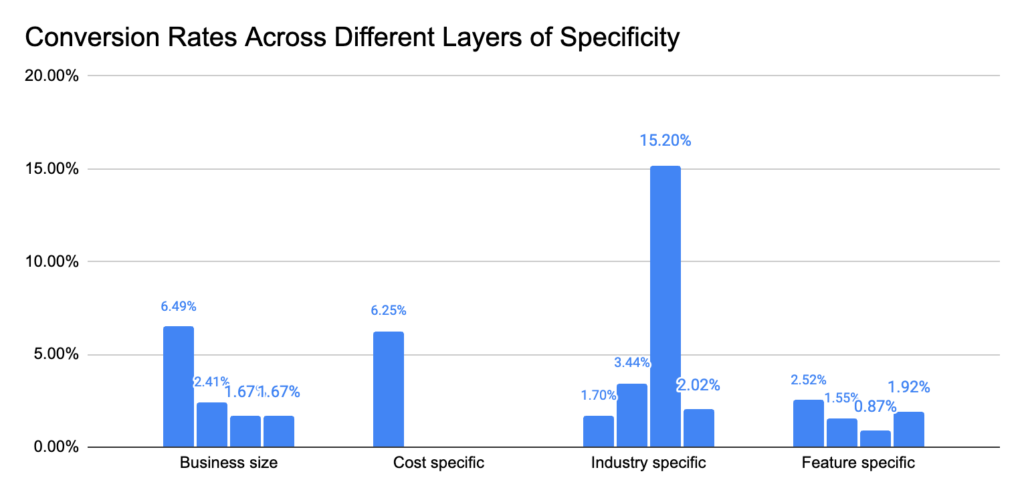
We grouped these by type of specificity in the keyword:
- Business size keywords could include “enterprise accounting software” or “accounting software for small businesses.”
- Cost specific keywords are typically around savings, like “budget-friendly accounting software” or “free accounting software.”
- Industry specific keywords speak to specific audiences, like “accounting software for HVAC business.”
- Feature specific keywords emphasize unique selling points, for example, “accounting software with inventory management.”
For example, that same digital asset software client is positioned mainly as an enterprise tool. So we targeted enterprise-focused keywords and keywords that attract smaller teams, and the results were not surprising: certain “enterprise” keywords converted around ~6.5% while other industry-specific keywords converted around ~2%.
Again, the more a keyword and article align with your product’s natural strengths, the higher the conversion rate.
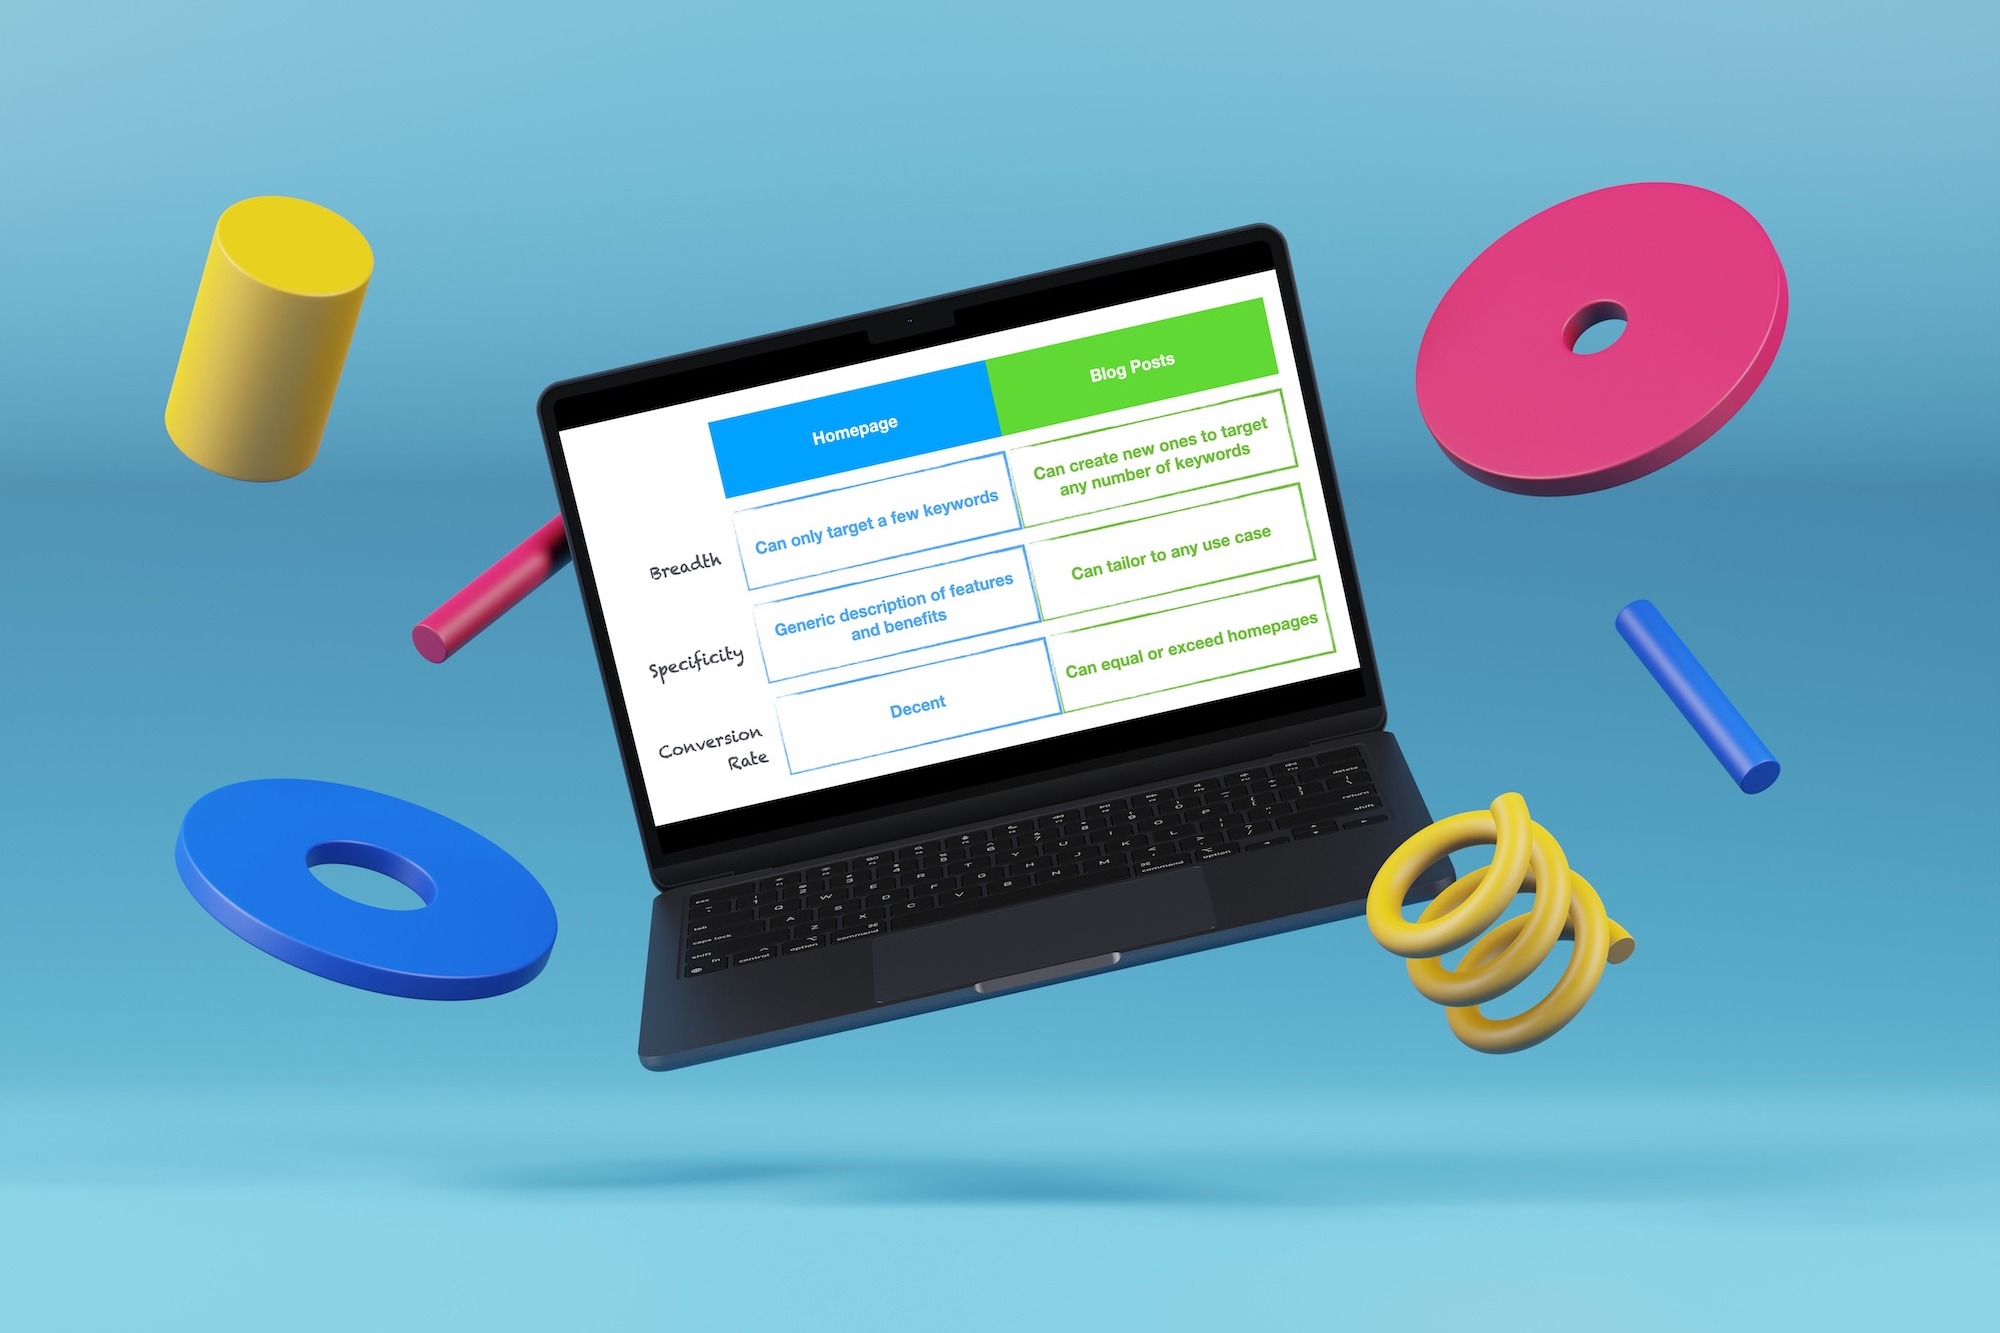
Most Category Keywords Need Long-Form Content to Rank
As we briefly mentioned above, most brands think of category keywords as something only their homepage, or maybe a landing page should target. Most don’t even consider long-form blog content as the right content type for category keywords. This thinking leaves a massive amount of opportunity on the table.
Here’s why:
- You can’t possibly rank in the top results (or even hit the first page) for every category keyword on your radar using just your homepage or a couple of feature or solution pages. You may be able to rank for one or two keywords, but there’s no way a single page will rank for the dozens of category keywords that likely exist in your space. It’s just very difficult to optimize a single page for that many different keywords (extreme long tail aside), so you’re leaving a lot of opportunity on the table.
- Your homepage isn’t tailored to specific audiences or queries; it contains high-level information about your brand and products/services. Unless readers are already familiar with or somewhat bought into your brand, this won’t capture their attention or drive desired actions from website visitors.
- People think their homepage or landing pages will always convert at a much higher rate than blog content. However, as per this data and previous comparisons, that’s not often true. Many homepages convert at low, single-digit percentages — usually less than a well-written blog post custom-tailored to sell your product or service.
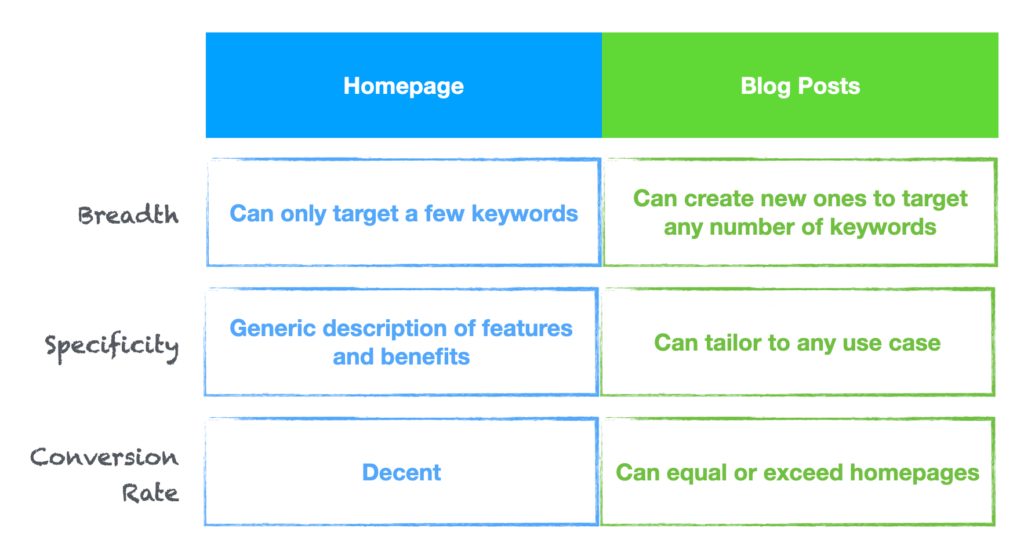
Creating unique content for each category keyword lets you solve the problems mentioned above.
First, since most of these category keywords require long-form, tailored copy to compete in SERPs, you actually have a chance of ranking and moving to the top of page one.
Second, creating long-form content (unlike a generic homepage) lets you speak to very specific pain points and challenges. You can actually tailor content around different search queries for specific readers — which attracts qualified leads, keeps audiences engaged, and improves conversion rates.
Let’s look at the keyword “free website analytics tools” as an example.
Here are some of the page one results in the Google SERPs:
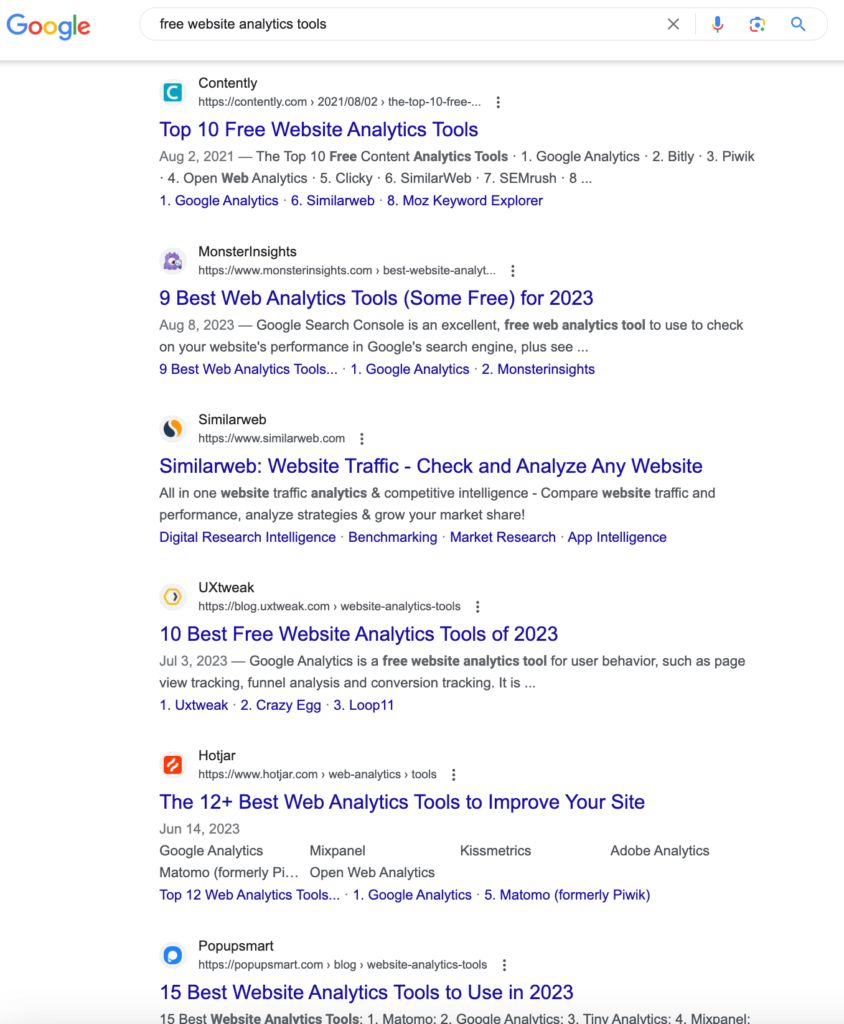
The SERP shows one list post after another comparing software solutions, with only Similarweb — an incredibly popular and longstanding analytics tool — ranking with their homepage. So, it’s incredibly unlikely that any other analytics tool is going to rank for this keyword with their homepage. You need to create a blog post to capture this organic traffic.
In fact, as of this writing, a post we wrote for our client Smartlook is ranking #1:
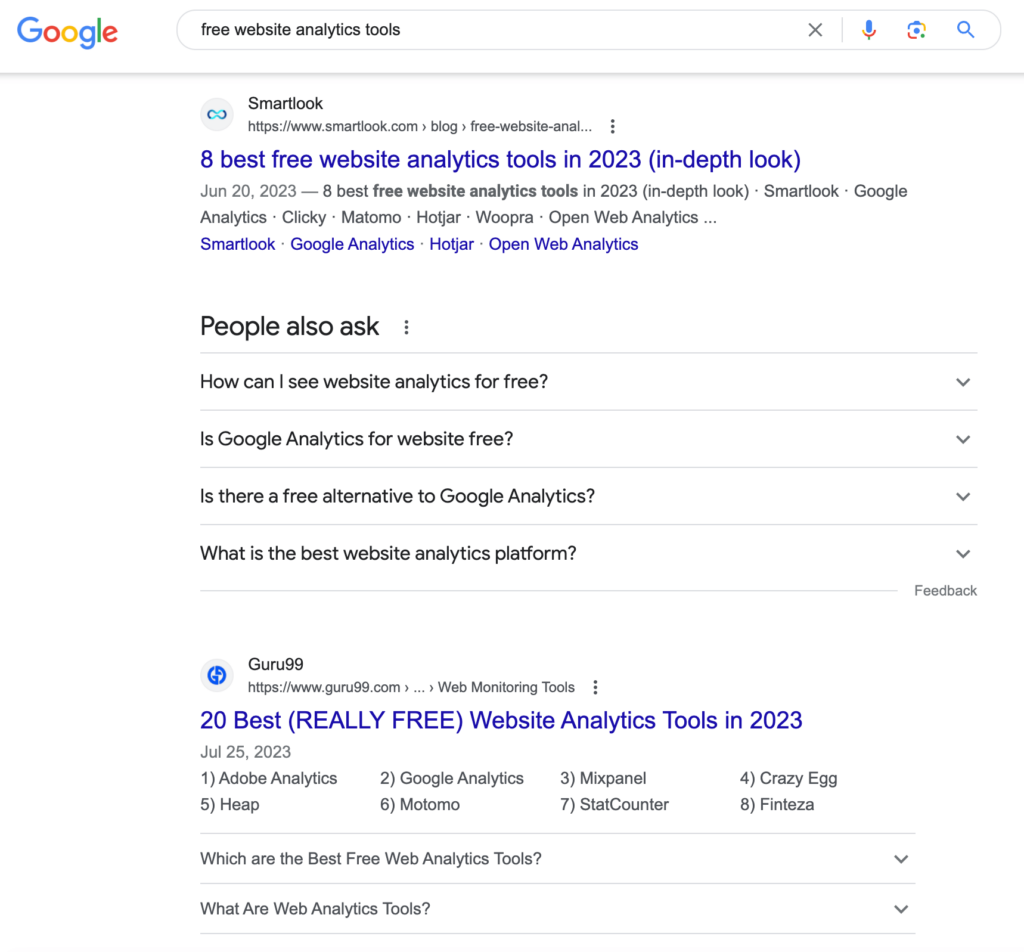
It would have been almost impossible to rank #1 for this keyword by attempting to optimize their homepage or even a dedicated product page for this keyword. Google’s search engine clearly favors lists.
There Are a Lot More Category Keywords Than Companies Realize
So many of the brands we talk to (whose analytics we see) haven’t systematically identified and targeted their category keywords — which is an absolute shame and waste of marketing potential.
As per the above data, we think you should brainstorm:
- The obvious category keywords and every variation of those terms that people may Google to find products or services exactly like yours.
- What layers of specificity could be added to those keywords that align with your product’s strengths.
Comparison and Alternative Keywords Are the Highest Converting SEO Keywords We’ve Seen
8.43% average conversion rate
One of the most interesting takeaways from this analysis is that comparison and alternatives keywords convert at a higher rate than any other keyword type.
This includes both alternative keywords like “salesforce alternative” and versus keywords like “Salesforce vs. Pipedrive.” Both of those keyword types, on average, convert better than even main category keywords.
We suspect this is because these Googlers are even more qualified than ones doing general research on a product or service. Clearly, these searchers:
- Already know about your industry.
- Are familiar with competitors who offer similar products/services as yours.
- Are actively comparing alternative solutions (with some vested interest in making a purchase).
So, you obviously want to show up for these users when they search these terms. Just be strategic in the competitor keywords you target and prioritize — as expected, this category will have a spread in conversion rates. From what we’ve noticed, keywords mentioning direct competitors will convert better than those featuring some loosely-related competitor.
For example, here is a visual comparison of conversion rates for all 23 competitor and alternative keywords we looked at in this study:
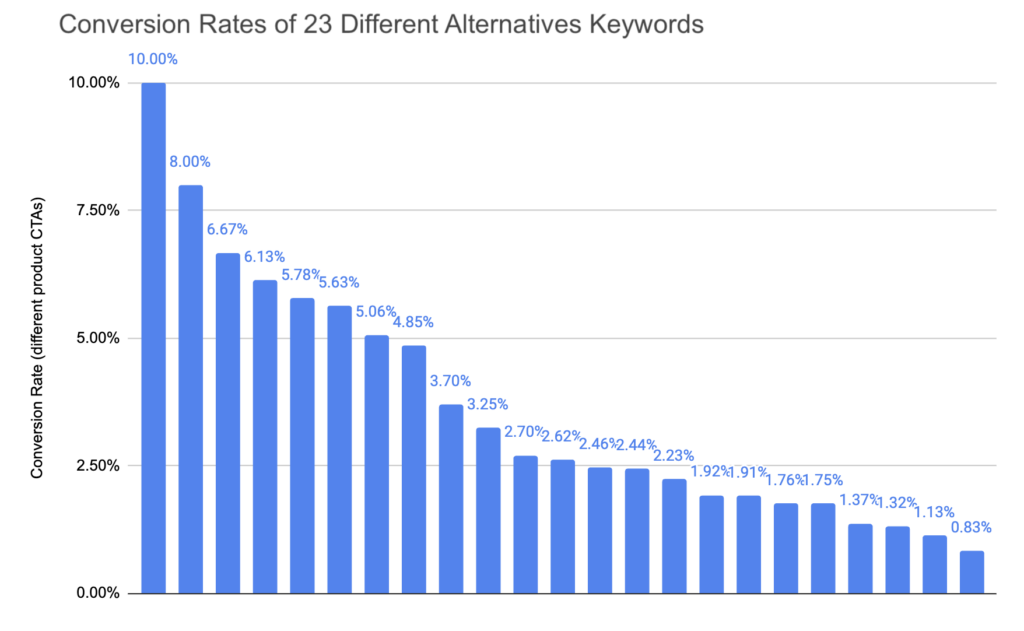
You can see that although the average conversion rate is 8.43%, the majority of these posts convert at less than 4%. That shows what we’re saying above: the closer the competitor, the higher the conversion rate.
That said, conversion rates between 1–4% are still far higher than top-of-funnel blog posts that barely convert; so in our experience and opinion, it’s worth taking bets on a variety of alternative and comparison keywords.
Finally, it’s worth mentioning that many competitor and alternatives keywords have very low organic search volume. As per our mini-volume keywords article, however, the high conversion rates make them very worthwhile to target.
Jobs To Be Done Keywords Show High Conversion Potential — Despite Being “Up the Funnel”
2.44% average conversion rate
The final category in our Pain Point SEO framework is “Jobs To Be Done” keywords — these are queries that describe a job to be done (or pain, challenge) that is best solved with your product or service.
These are slightly more up-funnel because they don’t explicitly say “software” or “tools” (like category keywords) or mention competitors (like alternatives keywords) — these are mostly “how to” queries: how to organize design files, how to do a poll in Slack, how to get video testimonials from customers.
Although these users may not be aware of your brand or competitors, or precisely what they need for their problem, they still have the potential to buy because they have a job or problem that you solve.
We insert our clients’ names in these conversations by creating content to specifically solve what the reader is searching for in the context of the client’s solution, and we see these convert at a ridiculously high rate.
For example:
- “Collect video testimonials” — a keyword we targeted for a video marketing client — has a 9.71% CR; this keyword presents a good opportunity for our client because the Googler requires some sort of software to do this task, and the task the Googler needs to complete is exactly what our client’s product solves for.
- A JTBD keyword we targeted for online meeting software is “how to run standups in Slack” — this has a 12.5% CR, and once again, our client’s product is a great way to do that exact job.
- We targeted “record website visitors” for a website analytics tool, and that converts at 10.48% (this Googler requires a specific type of software to complete this task, and our client offers that very solution).
JTBD Keywords with Little to No Buying Intent Are Considered “Top of Funnel” (And Least Likely to Convert Readers)
Similar to comparison and alternative keywords, there is a wide spread in conversion rates for JTBD keywords, and also similarly, intent drives that difference. We’ve noticed that JTBD keywords with low conversion rates simply don’t have that high of conversion rates.
The contrast here is stark:
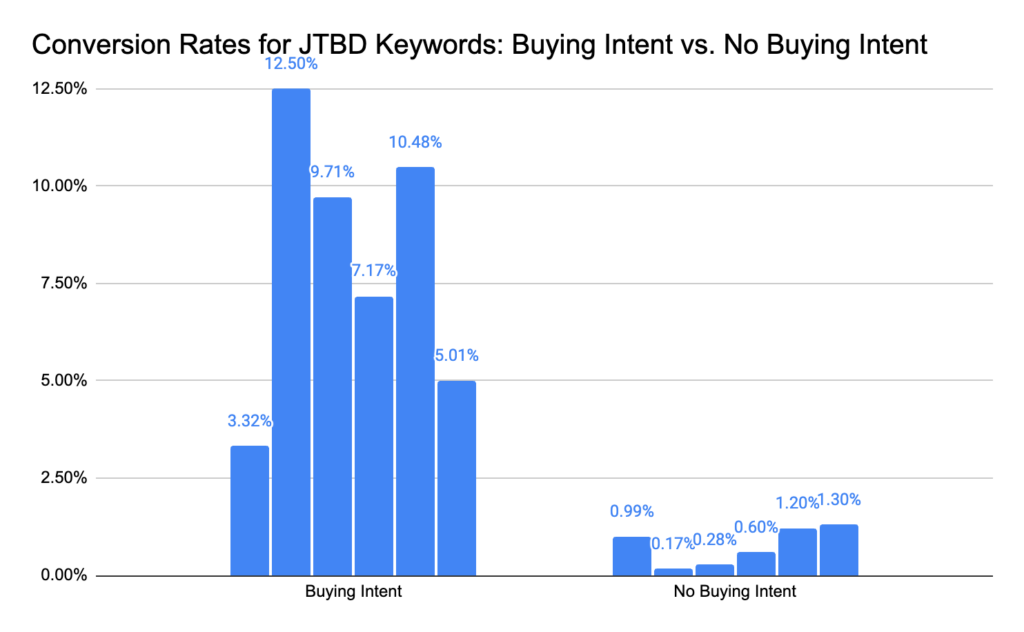
For example, for our video marketing client, JTBD keywords around collecting or gathering video testimonials (exactly what their software does) converted to free trials at 5–9%. But other JTBD keywords were less transactional: opportunities around what to say in a testimonial video converted at only 0.6%. That’s because no one needs to purchase software to learn what to say in a testimonial; they just need advice.
Overall Thoughts
There are a few takeaways from this analysis:
- Not all SEO keywords are created equally. Some convert extremely well (10%+), and others not at all. So, if you’re interested in SEO for lead generation and want to reach potential customers, you need to target bottom-of-funnel or high buying-intent keywords.
- Even within bottom-of-funnel keywords, there is a wide range of SEO conversion rates — depending on the type and level of intent of the keyword.
- It behooves every brand to target their main category keywords and comparison and alternative keywords related to their primary competitors.
- Jobs to be Done keywords are an often-overlooked category that also show a lot of potential for higher conversion rates.
If you want to learn more about conversion-focused SEO and conversion rate optimization, you can check out our course and community, where we and hundreds of other digital marketers discuss these marketing strategies. If you want to work with us directly, you can reach out here to learn more.
Note: We also offer PPC services. Rather than just focusing on click-through rate (CTR), we do careful keyword research and curate each campaign in order to maximize conversions per dollar spent.
Frequently Asked Questions
What is ‘SEO conversion rate’?
SEO conversion rate is the percent of organic traffic that completes a specific action on your website such as filling out a contact form or signing up for a free trial or subscription.
How do you calculate your SEO conversion rate?
SEO conversion rate is calculated by dividing total organic conversions by total organic website traffic.
SEO conversion rate = Organic conversions/organic trafficWhat is a good SEO conversion rate?
In our experience, typical blog posts that target high volume keywords convert at a rate of 1% or less. And the average homepage converts at a rate of about 3%. However, ranking for keywords with high buying intent often returns a conversion rate of 5% or higher.
What is conversion rate optimization?
Conversion rate optimization (CRO) is the process of maximizing the conversions you receive from your website.
When talking about CRO, most marketers mean the process of making small tweaks to a website to increase the conversion rate of a desired action, for example, making technical adjustments to decrease page load time or bounce rate, or A/B testing different calls to action (CTAs).
(It can be used to talk about overall website conversion rate or on a more granular level by blog post, product page/web page, keyword, etc.)
However, in our experience, these small tweaks aren’t all that impactful. Instead, we recommend focusing on choosing high buying-intent keywords.
You can learn more about conversion optimization in these posts:
Join the Grow and Convert Newsletter
Get our marketing ideas emailed weekly.
Explore Articles By Categories


Explore our Videos