
Last month we had 7,614 unique visitors (users) on this site.
In the next 30 days we want to get 20,000 users to our site. Not pageviews, not unique pageviews, not sessions…users.
I know, it’s absurd.
But we set a goal of hitting 40,000 users in a 30 day span in 6 months and we’re 3.5 months in, so it’s time to get serious.
A part of getting serious about growth is building a growth model.
Your company should have one for overall sales growth, and if our non-scientific survey of content marketing managers is any accurate, you probably don’t have a growth model for content marketing (i.e. the blog).
The good news is, it’s not that hard.
So, in this post I’m going to walk you through our simple bottom’s up traffic model for blog traffic growth on Grow and Convert. We’ll use this month’s forecast as an example.
[su_note note_color=”#daffb5″]Free Bonus: This whole post is based on a model I made as a Google Spreadsheet. Get the spreadsheet free, here, so you can modify it for your own site.[/su_note]
The Lack of a Traffic Growth Model for Content is Stressful and Dangerous
I recently surveyed folks that have run content marketing at companies, and this seems to be the way blog growth is “planned”:
- An executive comes up with a traffic goal: “We want 20,000 uniques a month by June!”
- Content marketing manager starts writing posts, hiring writers, and trying what they can in promotion until things work.
That can work, but man it’s stressful. And if you don’t hit your target, it’s not easy to see why.
Even worse, at early stage startups where the founders are doing everything (including content marketing) to get customers, the process is even more frantic:
- Write blog posts
- Do a million other things
I’m stressing out just writing those bullet points.
But the lack of a content marketing growth model isn’t a joke. Almost always, someone is banking on content bringing in a certain number of customers a month. The company is counting on it. They’re assuming a certain (growing) number of customers, trials, or leads coming in every month from content. That’s a dangerous assumption when there’s no growth plan for the blog.
Or, if there is a “model”, it’s often top down. That means traffic is just assumed to grow at a certain rate, as explained by Andrew Chen:
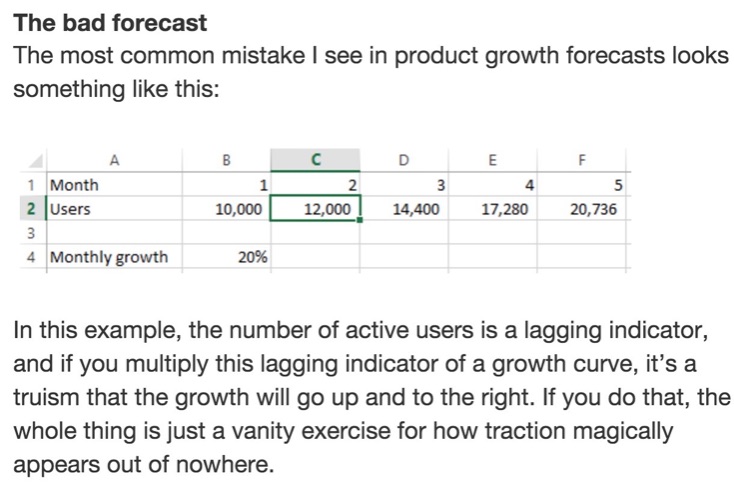
The independent variable is the growth rate (20% in the example above). That is, you’re just typing in 20%. So of course, by definition, you’ll grow at 20%.
It’s like having this conversation with your board:
“We’re going to grow from 10k to 12k next month.”
“Why?”
“Because I’m assuming we’re growing by 20% each month.”
…
“Unfortunately, we won’t be participating in the next round.”
See the logic gap?
That’s the reason Andrew Chen says it’s a “vanity exercise” — because the entire point of a model is to figure out what steps will lead to a certain growth percentage. Then, after you factor in all the steps you can take, the model should output a growth percentage from the previous month. If you just assume the percentage, you don’t have a model, you have a dream.
So that’s what most startups and even bigger companies do with their content marketing, they start at the target number and just do everything they can to hit it.
That’s a dream.
For example, we started this site with a goal to hit 40,000 unique visitors in a single month within 6 months. That’s our long term dream.
We’re 3.5 months in and over the next 4 weeks (i.e. March) we want to hit 20,000 users. That’s our short term dream.
Dreams are fine, but dreams with a plan are even better.
Our Traffic Growth Model for March
We now have enough data to get a feel for how much traffic each post gets on average and how many posts we can pump out based on our schedules. We also know how much organic traffic we’re getting (uhh, not a lot), and how much traffic the homepage and other “static” pages get.
So, we built this model for March:
We’ll walk through it step by step, but let’s start with the main characteristic: it’s bottoms up. We don’t type in 25,000 and hope for the best. We list out things we can control, use assumptions backed by data we’ve collected so far, and the model tells us how much traffic we can expect.
Let’s look into it.
How The Model Works and How You Can Adapt it For Your Company’s Blog
The model works like this:
- List out actions we can control
- Have data-backed estimates of how much traffic each action will produce
- Add up all those traffic numbers
Here are the actions for our model…
Traffic from Posts Published on Grow and Convert
This is obviously a key driver of traffic. Each post brings in a certain number of new users. The key is figuring out what that number is.
Google Analytics doesn’t just neatly hand you that number, so you have to do some calculations. Here’s how I did it.
Step 1: How Many Unique Pageviews Does a Post Produce?
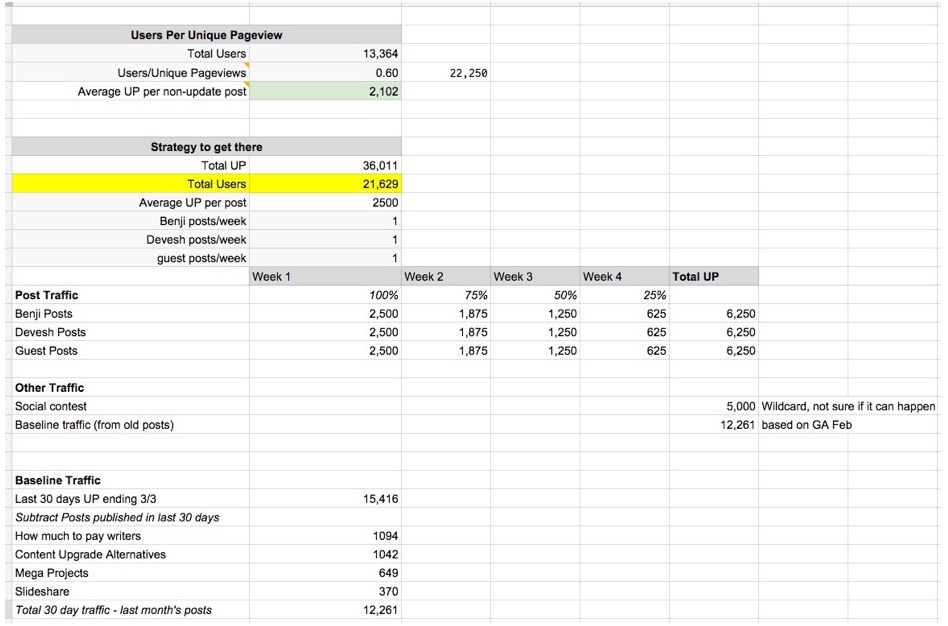
First, I figured out what the average post’s “unique pageviews” were over the (short) life of our blog:
This was 2,102 unique pageviews per post.
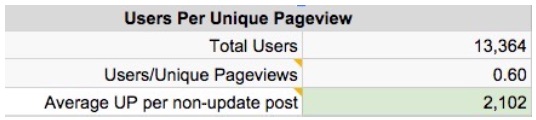
I excluded the homepage, about page, and update posts from the average because I want to know how much traffic a new non-update post produces.
Important Note: In any model, identify key levers that drive the whole thing.
Even in a bottoms up model, there are key assumptions that affect the result.
I call these levers.
A critical lever in our model is how many unique page views each post produces. That’s why we spent time getting a data-backed estimate of that number (2,102).
When you have data to back up your assumptions, you can adjust levers in an informed way.
For example, in our model we actually assumed each post in March will produce 2500 unique pageviews, not 2102. That’s intentional.
We know posts have averaged 2100 unique pageviews to date, so we are consciously and intentionally assuming we will eek out a few hundred more views per post (on average) in March. That’s the fun of having a bottoms up model where your key levers have data behind them: you can make these assumptions responsibly.
What affects this unique pageviews per post number?
In our case, the bulk of our traffic is from communities. So this number is a function of promotion and virality: where we promote it and how much attention it gets in those communities. We can control one but not the other.
We can control where we submit to. As we’ve shown in our monthly updates, our traffic is currently coming from GrowthHackers, Inbound, Facebook, and Twitter. Obviously, we’ll keep posting there.
But whether or not a post gets only 1500 pageviews:

…or 4,000 pageviews…

Isn’t really in our control. It’s a function of how well the post resonates with readers — which is hard to predict.
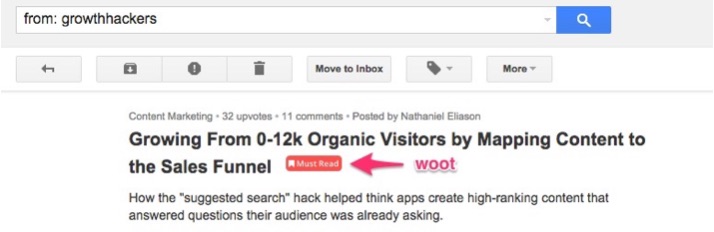
For example, the suggested search hack did so well because it got the “Must Read” label from GrowthHackers, and got added to their weekly email:
Posts also get picked up by other blogs and included in weekly roundups (these don’t actually bring in much traffic, by the way, but they are an indicator of popularity and help build links):
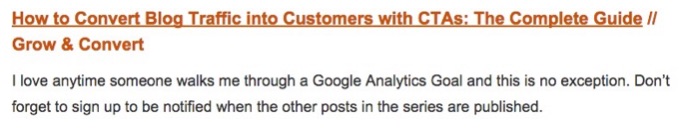
We’ve also had other posts make it into other marketers’ newsletters.
All of these things affect unique pageviews per post. We can’t predict these things, but we know it’s averaging 2,100 per post.
And with this knowledge in hand we can make an informed decision to model March at 2,500 unique pageviews per post, knowing that means we need to promote a bit harder.
Step 2: How does Unique Pageviews Translate to Users?
The second step is a detail. Since our goal is all about users (GA’s new term for unique visitors), we need to convert unique pageviews to users.
If you’re not interested in how this was calculated, skip to the next section.
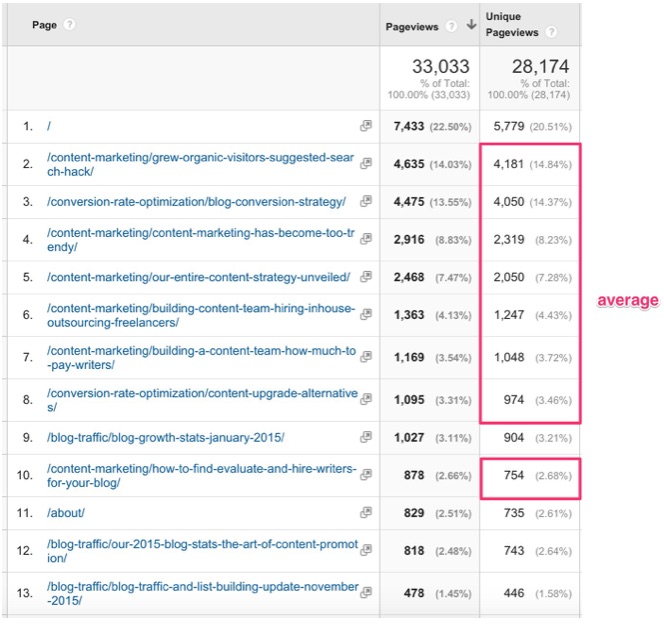
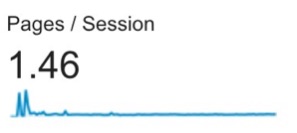
Calculating users per unique pageview isn’t straightforward, but I approximated it is by simply dividing the number of unique pageviews of the entire site (22,250) by the number of users over the life of the site (13,364) to get 1.66 unique pageviews per user.
Here’s a sanity check for this number, most users in a given session visit 1.46 pages. Although sessions, pages, unique pageviews, and users are all different things, I’d expect these two numbers (1.66 and 1.46) to be close, and the are.
So there you have it, now we know when we hit publish, how many unique page views and users we can expect the post will bring in in the first 4 weeks.
Step 3: Plan How Many Posts You’ll Write
You’ve calculated your lever of how much traffic a post can get, so now just plan out how many posts you’ll write over the next month.
In our case we also included who is going to write it. We have 3 categories: me, Benji, and guest posters.
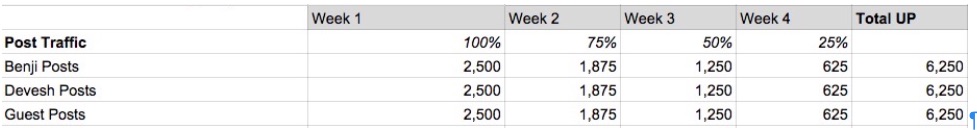
But calculating how much traffic each of those posts brings in isn’t as simple as multiplying each post by 2,500. Because that traffic doesn’t just show up the minute you hit publish.
In GA, we can see that the bulk of that traffic comes in the first 4 weeks:
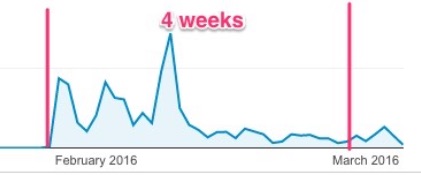
So I have to find a way to account for the fact that the posts in March won’t all be published on March 1.
There’s always a risk in building a model that you’ll waste time perfecting tiny details of a model. In order to prevent that I just assumed it was going to scale linearly.
Obviously that’s not true, we can plainly see in the above screenshot that most of the traffic comes in the first half of the month. So it’s not necessarily a good assumption but I think it’s close enough.
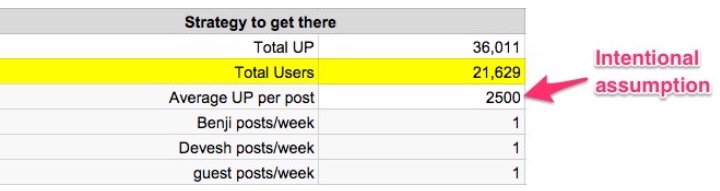
Overall, our model is saying we can get 18,750 unique pageviews in March with posts on our site.
Interesting Observation: Traffic from Guest Posts
Lastly, note something interesting in this model: guest posters. We are basically saying that any guest post published on our site should bring in 2500 unique pageviews in the first 4 weeks.
For that to be true the guest posts have to be the same quality as our posts and be promoted the same way. These two factors are more or less things we can control by saying no to guest post ideas we don’t think are good enough and promoting them the same way as our posts.
So, as we discuss below, we’re making a conscious choice to have guest posters post on our site instead of the other way around.
From a little bit of experience guest posting, we found that when we guest post elsewhere, we’re not bringing in anywhere near 2500 unique pageviews in the first month to Grow and Convert. So from a traffic perspective it makes more sense to have people posting on our site.
(That said, we fully understand other benefits of guest posting such as getting targeted exposure to certain audiences and link building. We also understand that for other niches where there may not be as many (or any) thriving communities like what we have, guest posting may be necessary to gain initial exposure.)
Other Traffic: Add In One Off Ideas and Your Baseline Traffic
After you cover traffic from posts on your site, now it’s just a matter of listing other things you can do to get traffic and adding those up.
This is where you would add things like guest posts, media mentions you’d get, etc.
In our case we only have two things here:
- A social contest
- Baseline traffic
What a Social Contest is and Why We’re Using it to Drive Traffic
We plan on running a giveaway (a social contest) using Rafflecopter or KingSumo Giveaways. We’ll announce that later, but in short they can really help grow the email list and they have the potential to go viral.
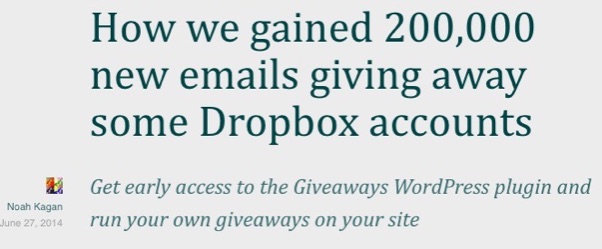
For example, the software deals company AppSumo got 200,000 emails by giving away free Dropbox pro accounts:
That’s extreme (and is a giveaway that appeals to a lot of people).
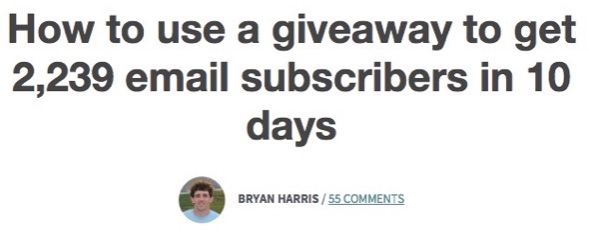
We want to attract a more specific audience (marketers inside of companies), and there have been examples of this done as well. Videofruit got 2,239 emails by giving away a decade of LeadPages, which clearly appeals to a lot fewer people than dropbox:
I’m approximating 5000 unique page views from our contest, but honestly, it’s hard to predict this number. In any model there will be assumptions that you’ll know are a little bit dubious. That’s okay. You’re still working bottoms up, and in this case our assumption is still within reason.
If Videofruit got a 50% conversion rate on their giveaway when users landed on the page, that’s already around 5,000 unique pageviews. So our assumption seems reasonable. (There’s a good chance the conversion rate of page visitors to optins was even less than 50%, so traffic would be even higher.)
How well our contest does is going to depend on how attractive our offer is, how viral the whole thing is, how good of a job at promotion we do, how many people decide to share it.
But the beauty of this is that even if we’re very very wrong, because our model is bottoms up, we can see exactly how wrong we were and how much that affected final traffic numbers. We’d just plug in the actual number here:

This is not possible in the top down model I mentioned in the top of the post, where you just assume 20% growth per month. In that case, if you don’t hit 20% that month, what do you do?
With this model, whether our social contest fails, our posts don’t get as much traffic as we hoped, or for any other reason we don’t hit our goal, we’ll be able to pinpoint why.
That’s a big deal.
Baseline Traffic
So far we’ve added in traffic from actions we plan to do in March:
- new posts
- a social contest
Now, we need to add that to the traffic that’ll just continue from the posts already on the site: the baseline traffic.
The way I’m approximating that is by finding the baseline for February, and assuming the same number for March, which errors on the conservative side.
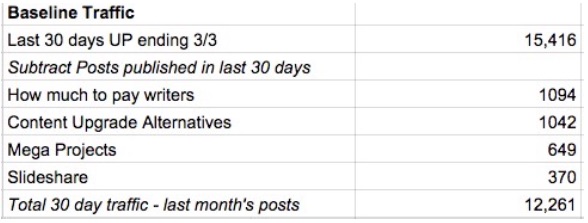
So I looked at the last 30 days from March 3 (close enough to end of Feb). We got 15,000 unique pageviews. Then, I just subtracted unique pageviews from the posts we published in February, and was left with 12,000 unique pageviews.
I’m assuming the same thing is going to happen in March, which is conservative since it’s likely that the baseline traffic will increase month over month as we publish more and more people link and share our articles.
Adding Up Each Component Of the Model and Calculating Our Final Traffic Number
We’ve modeled traffic from these sources:
- New posts we’re going to publish (19,000)
- A social contest (5,000)
- Baseline traffic (12,000)
It all adds up to 36,011 unique pageviews, which translates to 21,629 users (0.6 users per unique pageview).
Here’s the Fun Part: Tweaking Assumptions
Now the fun of a bottoms up model. We can tweak assumptions and see how that affects our goal.
For example, let’s say we don’t hit 2500 page views per post and only get 1500 per post on average. How does that affect things?
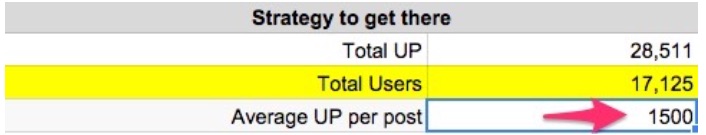
Looks like we’ll then hit 17,000 users instead of 21,000. Good to know.
Or let’s say our Week 4 posts are published way too late at the end of March and we get basically 0 traffic from them in the month:
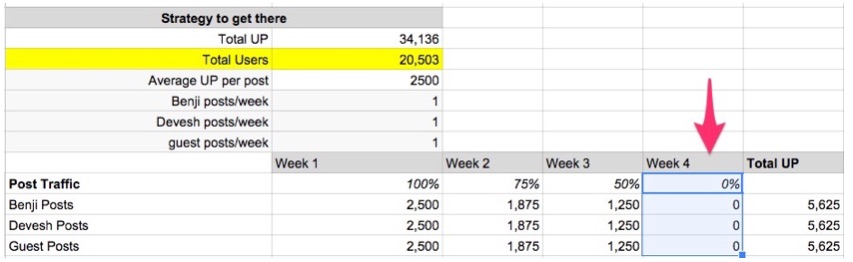
That won’t drop us down too much, we’d still hit 20,000 users in March. Good to know.
Or what if our social contest bombs and we only get 200 page views in stead of 5000? That’d drop us down to 18,700 users for the month. Not catastrophic. Good to know.
See the benefit? Now we can choose our actions and make compromises throughout the month with clarity on how that will affect the final numbers. And if things don’t go as planned, we’ll know why.
Things We Aren’t Including: SEO and Guest Posts on Other Sites
You’ll notice some things that are conspicuously missing from the model.
For example, SEO. We don’t have much SEO traffic! Our domain is 3.5 months old and we just don’t have a lot of it right now:
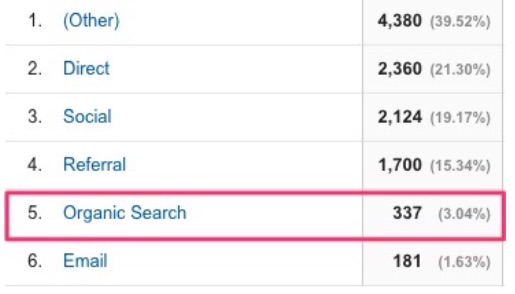
We only got 337 pageviews in February from organic. We’d love for that to be 3,370 but it’s not. That’s okay, we know that long term serious traffic growth will require SEO and link building will be a priority for us soon and we’ll get that number up, but it takes time.
Technically SEO traffic is baked into our baseline traffic, but other we’re making zero effort to calculate it more carefully or intentionally than that, simply because it’s too low.
Guest Posts on Other Sites
As we mentioned above, we did a couple guest posts and didn’t seem to get anywhere near even 1000 uniques from them so we’re going to stick to posts on our site.
Not only should that help immediate traffic, that will obviously help in terms of getting SEO traffic up long term.
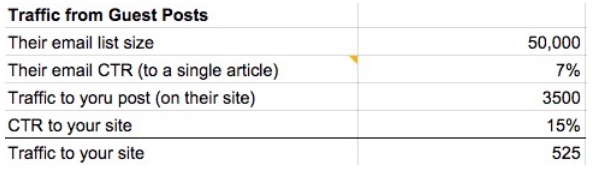
If you’re curious, we built a little mini-calculator in our model where you can approximate how much of a traffic surge you can expect from a guest post based on the site’s email list.
For example if they have a 50,000 person email list and a 7% CTR, and email just your article in the email, here’s what you could expect (based on my assumptions):
Or a smaller, more engaged list with a dedicated email for just your article:
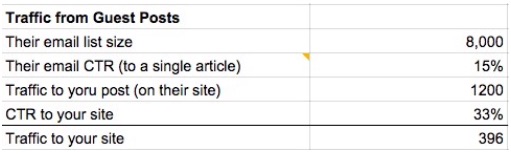
With this mini calculator in hand, you can ask sites their list size and average CTR so you can get a decent estimate of how much traffic you may get from it.
Here Are the Steps to Do This Yourself
Ok let’s review.
Step 1 – Actions: List out traffic sources you can control.
Things like:
- on-site posts
- off-site guest posts
- paid promotion
- media mentions through a PR effort
- giveaways/contests
Step 2 – Data: Based on prior data, calculate how much traffic each action gets
Step 3 – Add: List out how many of each action you’ll do, multiply by how much traffic each action will bring in and add.
Step 4 – Play: Adjust the assumption, see what the key drivers are, estimate best and worst case scenarios.
I hope more than anything else you learned the benefits of building a bottoms up model for planning growth of any kind — with content marketing as an example.
If you want to do this for your company’s blog using our model as a starting point, you can get our model in Google Docs for free by joining our email list here.
Questions, comments, or suggestions? Ask below, we answer almost every single one.
Want us to write an in depth case study or story like this about you or your company? We’ll also drive traffic to it. Apply here.
Like this article? We produce stories like these for our clients, learn more here.
Get the Growth Model
Where should we send the link?
We'll send it by email and add you to our free newsletter, where we send in depth content marketing articles (like this one) as well as exclusive email-only ideas about once a week. It's free and you can unsubscribe at any time.
Join the Grow and Convert Newsletter
Get our marketing ideas emailed weekly.
Explore Articles By Categories


Explore our Videos