Our following research takes a deep dive into the financial landscapes of the Fortune 500 global companies list, unraveling the intricacies of their profitability and disparities between U.S. and international counterparts.
In the fiscal year ending March 31, 2023, the top 500 companies amassed a staggering $41 trillion in revenue, yielding a profound $2.9 trillion in profits. The U.S. emerged as a profit behemoth, with its 136 Fortune 500 companies contributing a massive 38% to the global profit pool.
This study meticulously examines sector-wise profitability, country comparisons, and the highs and lows within the Fortune 500, offering a panoramic view of the world’s economic powerhouses.
Key Findings
- Global Giants: Fortune 500 companies amassed a colossal $41 trillion in revenue, with $2.9 trillion in profit.
- Top Global Profit Makers: The top 10 companies globally amassed $689.8B (24%) in profit, with Saudi Aramco leading at $159.1B.
- Global Losses: The bottom 10 companies worldwide incurred a collective loss of nearly $126B.
- U.S. Dominance: U.S. companies (136) secured a remarkable $1.1T profit, overshadowing China’s $528B, despite similar company numbers.
- The U.S. and China jointly generate 56% of the global 500 companies’ profit.
- Sector Powerhouses: Technology, Finance, and Energy sectors claimed 63% of the $2.9 trillion global profit.
- U.S. Sector Standouts: The Technology sector in the U.S. emerged as the most profitable, generating $306B, constituting 28% of the country’s total profit.
- Top U.S. Performers: The top 10 U.S. companies contributed 46% of the $1.1 trillion total profit, led by Apple.
- Sectoral Disparities: Media, Wholesaler, and Retail sectors in the U.S. lagged behind with profit margins of 0.76%, 1.53%, and 2.60%, respectively.
Top 500 Most Profitable Companies: U.S. vs. the World [Infographic]
10 Most Profitable of the Largest Companies in the World, 2023
The elite league of the world’s 10 most profitable companies in 2023 showcases a powerhouse of financial success. These industry giants, representing the Energy, Technology, Transportation, and Financial sectors, collectively amassed a jaw-dropping $689.8 billion in profits, constituting 24% of the total profit from the analyzed Fortune 500 companies.
The average profit per company within this elite group is an impressive $69 billion.
Notably, half of the top 10 are U.S.-based corporations, underlining the economic dominance of American businesses on the global stage.
Each of these companies showcases the diverse financial prowess across sectors in 2023. Saudi Aramco steals the spotlight with an unparalleled profit of $159.1 billion, accounting for a remarkable 5.49% of the global 500 total profit — emphasizing the dominant role the energy sector plays in generating substantial financial gains.
The U.S. Postal Service surprises as the only representative in the transportation sector, boasting a remarkable profit of $56 billion (71.29%) with a revenue of $78.6 billion, outshining all of its peers with ease.
In the technology realm, Apple, Microsoft, and Alphabet secure top positions, collectively contributing $232.5 billion in profit. Microsoft stands out with an impressive profit margin of 36.69%, underscoring the profitability potential in software and technological solutions.
In the financial realm, Industrial & Commercial Bank of China and China Construction Bank secured their spots by contributing a combined profit of $107.7 billion.
The energy sector, represented by Exxon Mobil and Shell, contributes significantly too, with both companies together accounting for $98 billion in profit.
Overall, this top 10 ensemble underscores the global impact of varied industries, from energy giants to technology titans, that shape the financial landscape with substantial profits.
10 Least Profitable of the Largest Companies in the World, 2023
The bottom 10 companies in 2023, however, collectively faced significant financial challenges, accumulating a staggering combined loss of almost $126 billion during the analyzed fiscal year.
Notably, industry giants Berkshire Hathaway and Uniper, ranked 14th and 16th in Fortune’s official ranking with huge revenues of $302.1 billion and $288.3 billion, respectively, found themselves among the least profitable.
The average loss per company within this group amounted to -$12.6 billion, reflecting the significant financial challenges these companies encountered.
The energy sector, represented by Uniper, Korea Electric Power, Electricité de France, and CPC, dominates the list, collectively contributing to a substantial $53.2 billion in losses.
Meanwhile, technology and telecommunications companies, such as Uber Technologies, AT&T, Warner Bros. Discovery, and SoftBank Group, have also had to grapple with substantial losses, emphasizing the many challenges faced across diverse sectors.
The inclusion of well-known names like AT&T and Uber in the least profitable list helps to highlight the wild unpredictability and volatility inherent in today’s global business landscape.
Most Profitable Sectors for the World’s Largest Companies, 2023
The top 3 sectors — energy, finance, and technology — emerge as the most profitable among the world’s largest companies in 2023, collectively contributing to a massive 63% of the total global profit, amounting to $1.8 trillion.
With a profit share of 24.56%, the energy sector takes the lead, bolstering $711.6 billion in profit by 88 companies within the Fortune 500.
Finance follows closely, with 101 companies and a 23.07% profit share, showcasing it still holds considerable financial dominance.
Technology, represented by 35 companies, secures a notable 15.54% profit share, underlining its continued significance in the profit landscape.
Healthcare, represented by 30 companies, holds a 7.51% profit share with $217.6 billion in profit and significantly contributes to the profitability of the world’s largest companies.
Transportation, with 22 companies, secures a notable 5.54% of total profit, amounting to $160.5 billion in profit. The sector’s role in facilitating global movement is evident in its substantial profit share.
Motor Vehicle and Parts, encompassing 34 companies, contribute a noteworthy 5.36% to the global profit, generating $155.4 billion. The automotive industry’s impact is still substantial, albeit with a slightly lower profit margin compared to other leading sectors.
The remaining sectors, including Food, Beverages and Tobacco, Telecommunications, Retail, Materials, Wholesaler, Industrial, Engineering and Construction, Household Products, Aerospace and Defence, Chemicals, Food and Drug Stores, Apparel, and Hotels, Restaurants, Leisure, collectively make valuable contributions to the global profit landscape, showcasing the diverse strengths and importance of each individual sector.
This analysis helps to highlight the diverse strengths and contributions of various sectors across the globe, with energy, finance, and technology leading the charge in shaping the financial landscape of the largest global enterprises.
Ranking Countries by Total Corporate Profit, 2023
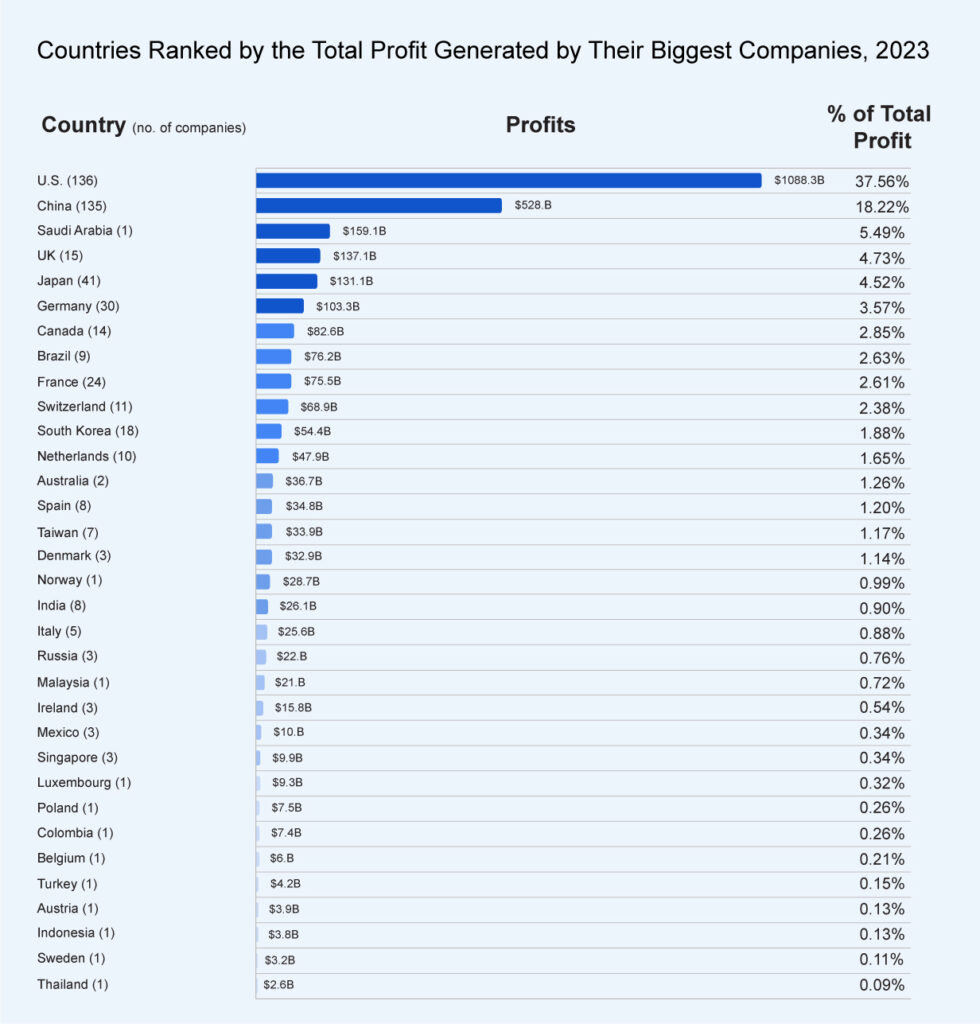
In the dynamic landscape of global corporate giants, the United States and China emerge as titans, each housing a near-equal number of companies on the Fortune 500 list with revenues totaling $13 trillion and $11.2 trillion, respectively.
Despite this similarity, the U.S. outshines all nations, with its 136 companies generating a staggering $1.1 trillion in profit, representing 37.56% of the total global profit. China follows closely, with 135 companies contributing $528 billion, comprising just under half of the U.S.’s global profit pool with 18.22%.
The combined force of the U.S. and China stands out, jointly accounting for $1.6 trillion (56%) of the total profit, surpassing all other countries combined, which contribute $1.3 trillion (44%) in total.
Saudi Arabia secures the third position with a single company generating $159.1 billion in profit, making it 5.49% of the total global profit.
Continental Analysis
In the global landscape of corporate profitability, North America takes the top spot as the foremost economic powerhouse, contributing an impressive $1.18 trillion in profit and commanding a substantial 40.75% share of the global profit. The United States emerges as the major player within the continent, underscoring its unparalleled economic influence.
Venturing across the pond into Europe, the continent collectively generates $629.9 billion in profit, claiming a notable 21.74% share of the global profit. The UK and Germany take the lead among European nations, showcasing their economic strength and significant corporate contributions.
Across the expansive and diverse Asian continent, encompassing China, Japan, and Saudi Arabia, the combined profit amounts to $974 billion, representing a formidable 33.62% share of the global profit. China, Japan, and Saudi Arabia emerge as major contributors, collectively illustrating Asia’s substantial economic influence.
Brazil is the only South American country. Their corporate entities contribute significantly to the global profit pool, generating $76.2 billion and holding a 2.63% share.
Australia, positioned in the Asia-Pacific region, makes a notable impact with $36.7 billion in profit, constituting a modest 1.26% share of the global profit.
This continental analysis provides a comprehensive and clear overview of corporate profitability, showcasing the major players and their contributions within each region.
Top 10 U.S. Companies with the Highest Profit, 2023
In the dynamic landscape of corporate profitability within the United States, the top 10 companies among the Fortune 500 elite emerge as extremely formidable contributors.
These 10 corporations, out of a total of 136 U.S. companies, collectively generate a staggering $499.5 billion in profit, comprising an impressive 46% of the total profits amassed by all 136 U.S. entities.
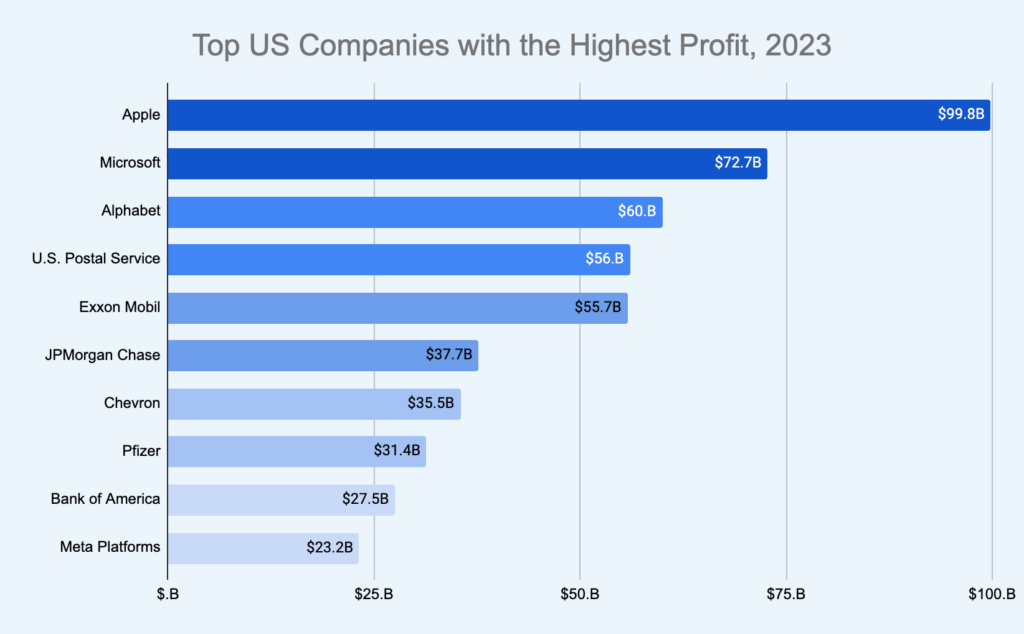
Apple leads the pack, commanding a lion’s share with $99.8 billion in profit, constituting 9.17% of the overall profits among U.S. companies.
The composition of the top 10 reflects a diverse range of sectors, with technology taking the lead. Following Apple, Microsoft and Alphabet secured the second and third positions, contributing $72.7 billion and $60 billion in profit, respectively.
The U.S. Postal Service, representing the transportation sector, stands out with a remarkable profit of $56 billion.
Continuing down the list, energy giants Exxon Mobil and Chevron contribute significantly, with profits of $55.7 billion and $35.5 billion, respectively.
Financial institutions JPMorgan Chase and Bank of America showcase their dominance, with profits amounting to $37.7 billion and $27.5 billion, respectively.
Meta Platforms, a technology giant, rounds out the top 10, contributing an impressive $23.2 billion in profit.
This collective dominance underscores the significant role played by these select few in steering the economic trajectory of the nation.
Top 10 U.S. Companies with the Highest Loss, 2023
In the realm of corporate challenges, the top 10 U.S. companies with the highest losses faced a combined setback of $66.9 billion.
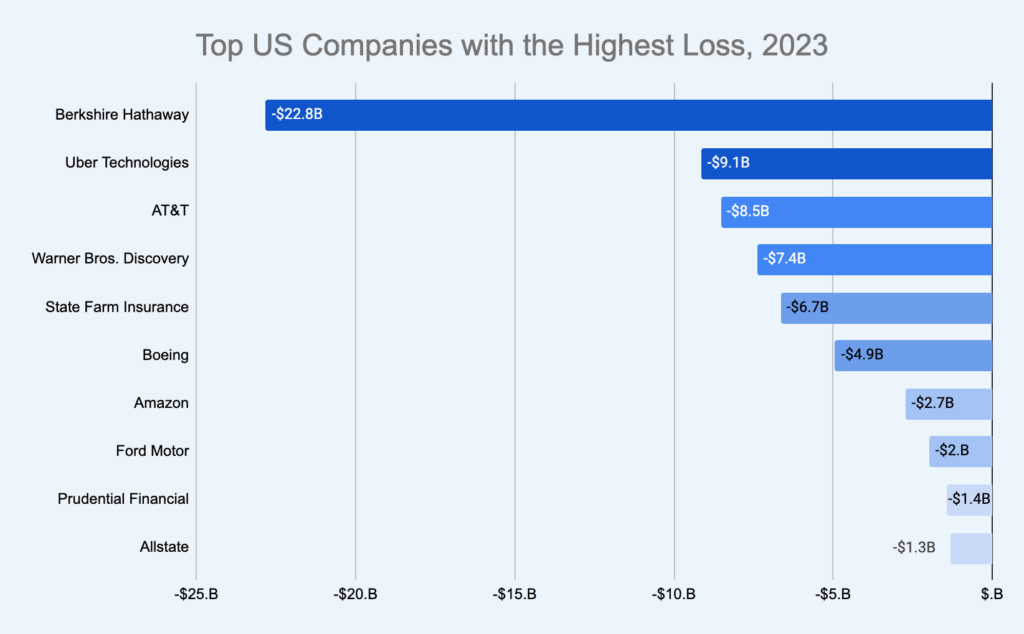
Notable among the highest losers are Amazon and Berkshire Hathaway, ranking as the 4th and 14th largest global companies, with massive revenues of $514 billion and $302.1 billion, respectively. Despite their prominent positions, both companies incurred significant losses during the analyzed period, with Amazon reporting a surprising loss of $2.7 billion, and Berkshire Hathaway facing a substantial loss of $22.8 billion.
Uber Technologies and Warner Bros. Discovery experienced the most significant percentage losses, with 28.68% and 21.80%, respectively.
Intriguingly, four out of the top 10 least profitable companies in the U.S. belong to the Financials sector—Berkshire Hathaway, State Farm Insurance, Prudential Financial, and Allstate.
These challenges illuminate the diverse landscape of corporate performance, emphasizing the sectoral variations within the top companies experiencing losses.
Most Profitable Sectors for the Top U.S. Companies, 2023
The technology sector emerges as the powerhouse for the top U.S. companies, contributing significantly to the country’s total profit of $1.3 trillion.
With a remarkable $306 billion in profit, the technology sector commands a substantial 28% share of the overall profit generated by all sectors. Impressively, the Technology sector also showcases a robust profit margin of 19.76%, underscoring the efficiency and profitability of tech companies within the U.S. corporate landscape.
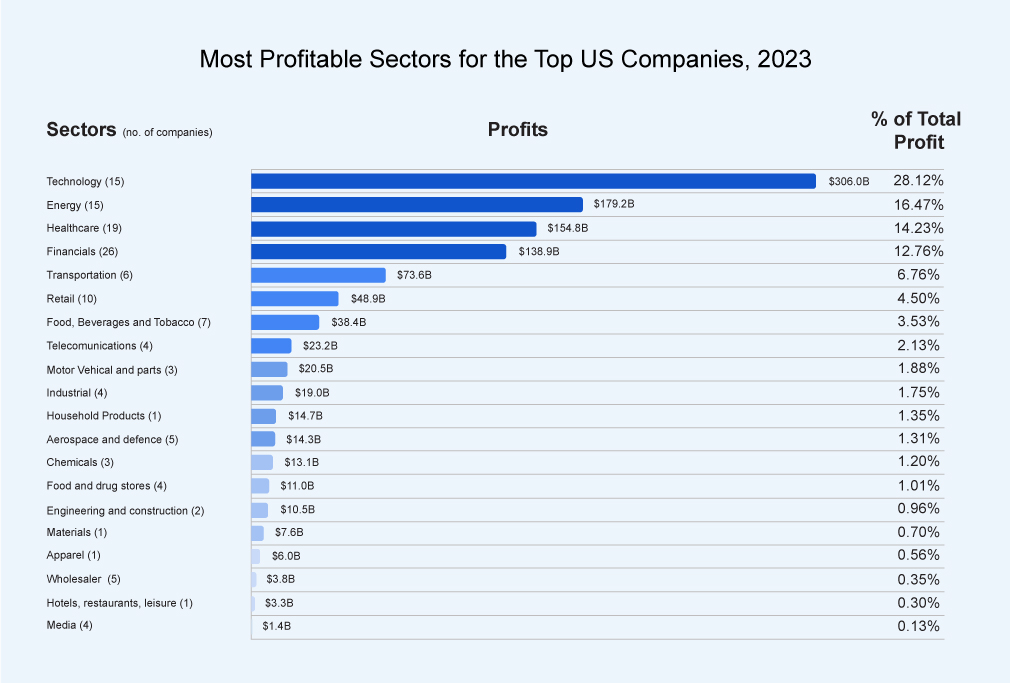
The top four sectors—Technology, Energy, Healthcare, and Financials—stand out as major contributors, collectively accounting for 75 companies and generating a substantial $779 billion in profit, representing 72% of the total profit across all sectors in the United States.
Healthcare, with the highest total revenue of $2.5 trillion, further solidifies its prominence.
On the other end of the spectrum, the Media, Wholesaler, and Retail sectors exhibit the least profitability, with profit margins of only 0.76%, 1.53%, and 2.60%, respectively, highlighting the modern-day challenges faced by these sectors in the specified fiscal year.
Methodology
Our comprehensive analysis delved into the profitability of companies listed in the Fortune 500, a globally recognized list comprising companies with the highest revenue. Our objective was to shed light on the most profitable companies and sectors worldwide, with a particular emphasis on how U.S. companies fare in comparison to their international counterparts.
Approach to Analysis
- Data Source: We sourced our data from the Fortune 500 list, ensuring that we based our insights on a reliable and respected global business ranking.
- Profitability Focus: The primary focus of our analysis was profitability. We evaluated not just the revenues but more importantly, the profits of these companies to gauge their financial health and performance.
- Sector-Wise Analysis: We categorized companies based on their operational sectors, allowing us to identify which industries are leading in terms of profitability and which are facing challenges.
- U.S. vs. Global Comparison: A significant part of our analysis involved comparing the performance of U.S.-based companies against those from other parts of the world. This comparison provided a broader understanding of the global business landscape.
- Interpretation of Data: By reorganizing and scrutinizing the data from multiple perspectives, we aimed to extract valuable insights into the financial health and market positioning of these leading entities.
The methodology employed in this analysis enabled us to gain a nuanced understanding of the financial dynamics at play within the Fortune 500 companies. It highlighted the sectors and regions that are leading in profitability, providing a clear picture of the current state of global business and economic trends.
Join the Grow and Convert Newsletter
Get our marketing ideas emailed weekly.
Explore Articles By Categories


Explore our Videos