Like we’ve said before CAC is the most important metric in marketing.
Marketing’s goal in most organizations is to acquire leads affordably.
We even built a simple spreadsheet model to help you do that (in the article linked above).
But a critical problem we’ve noticed from building content strategies for companies is that most aren’t even measuring leads generated from content.
You can’t calculate cost per customer acquired when you don’t know how many customers were acquired.
In this article, I’ll outline an extremely simple way to begin attributing leads generated from the blog: Using a thank you page combined with Google Analytics goals.
It’s something that is insanely easy to setup, involves only GA (which most companies use), and will give most companies a lot more insight than what they have now.
Most companies don’t have Google analytics goals set up to track blog conversions, so let’s fix that.
[su_note] If you’d like to learn how to attribute leads to content with video examples, we also share this process and more, in our course and community. [/su_note]
The Two Step Process to Measuring Leads with Google Analytics Goals
Here’s a typical flow for lead generation (I’m using a B2B sales driven model as an example, you can replace “lead” with “free trial” or equivalent for self serve businesses):
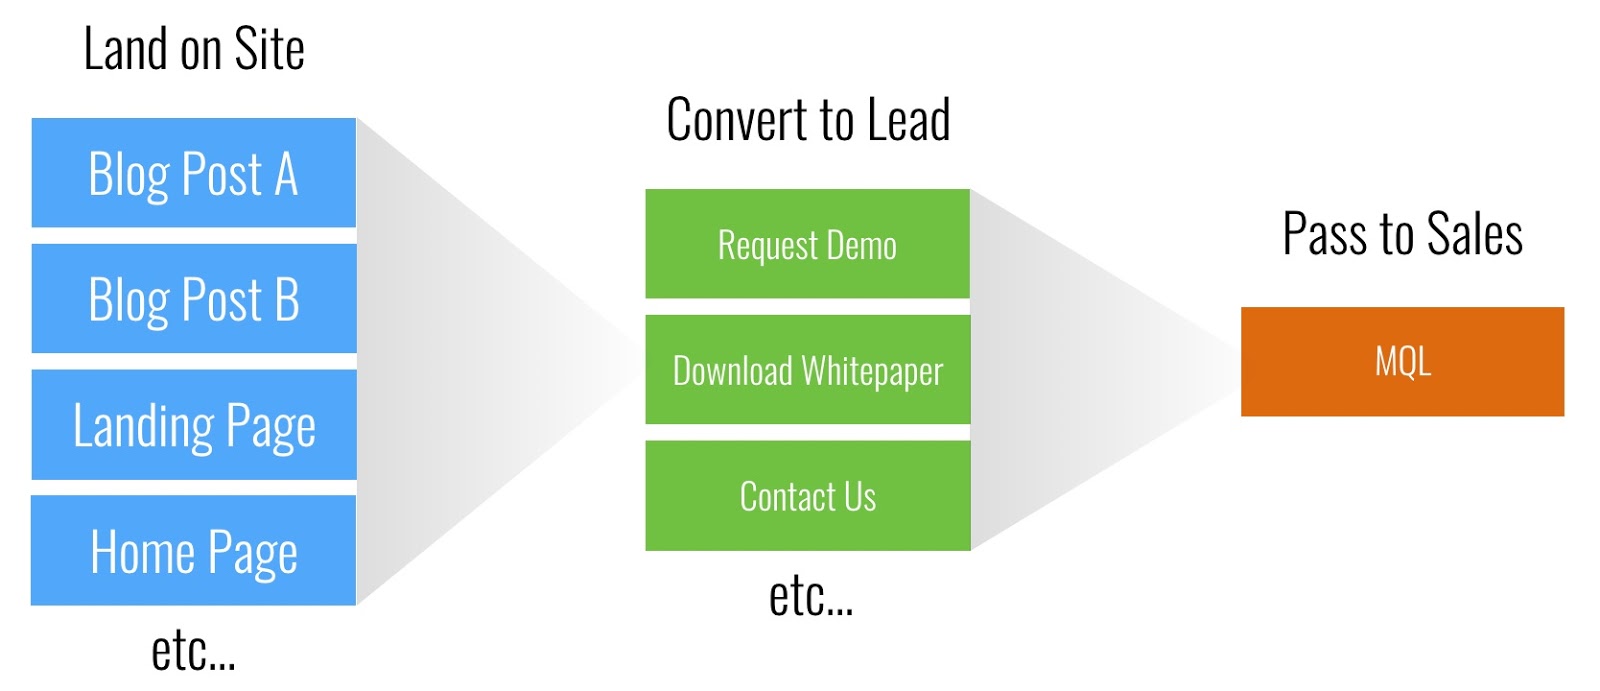
The Thank You Page Goal method involves just 2 steps to measure how many leads can be ascribed to content vs. other acquisition channels.
Step 1: Make sure the lead form goes to a unique thank you page
When someone “converts to lead” in the green column above, they should be sent to a unique thank you page after they fill out a form, regardless of what page they were on when they started.
Visually, you can think of it like this:
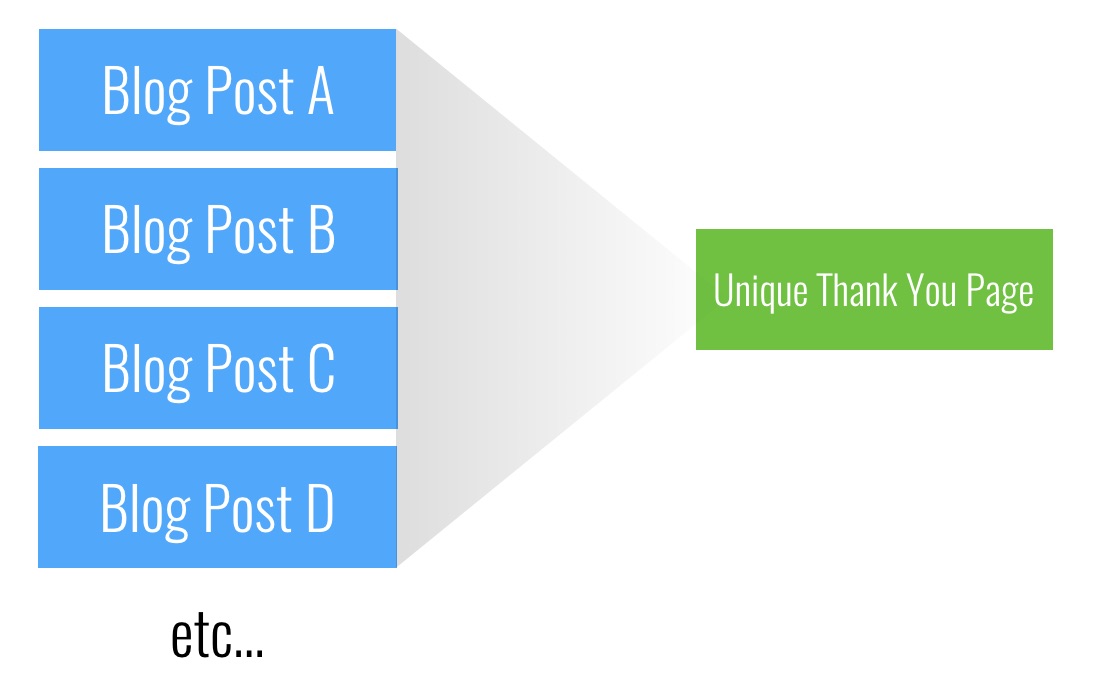
What do I mean by unique? Just that traffic to that page comes only from filing out the form, nothing else.
So, for example, if your lead form is on the homepage and submitting it just reloads the homepage or creates a dynamic “thank you” message via javascript, this simple method won’t work for you, you’ll need to do something fancier.
For an example of how it should work, take our thank you page: www.growandconvert.com/thank-you, here’s a screenshot:
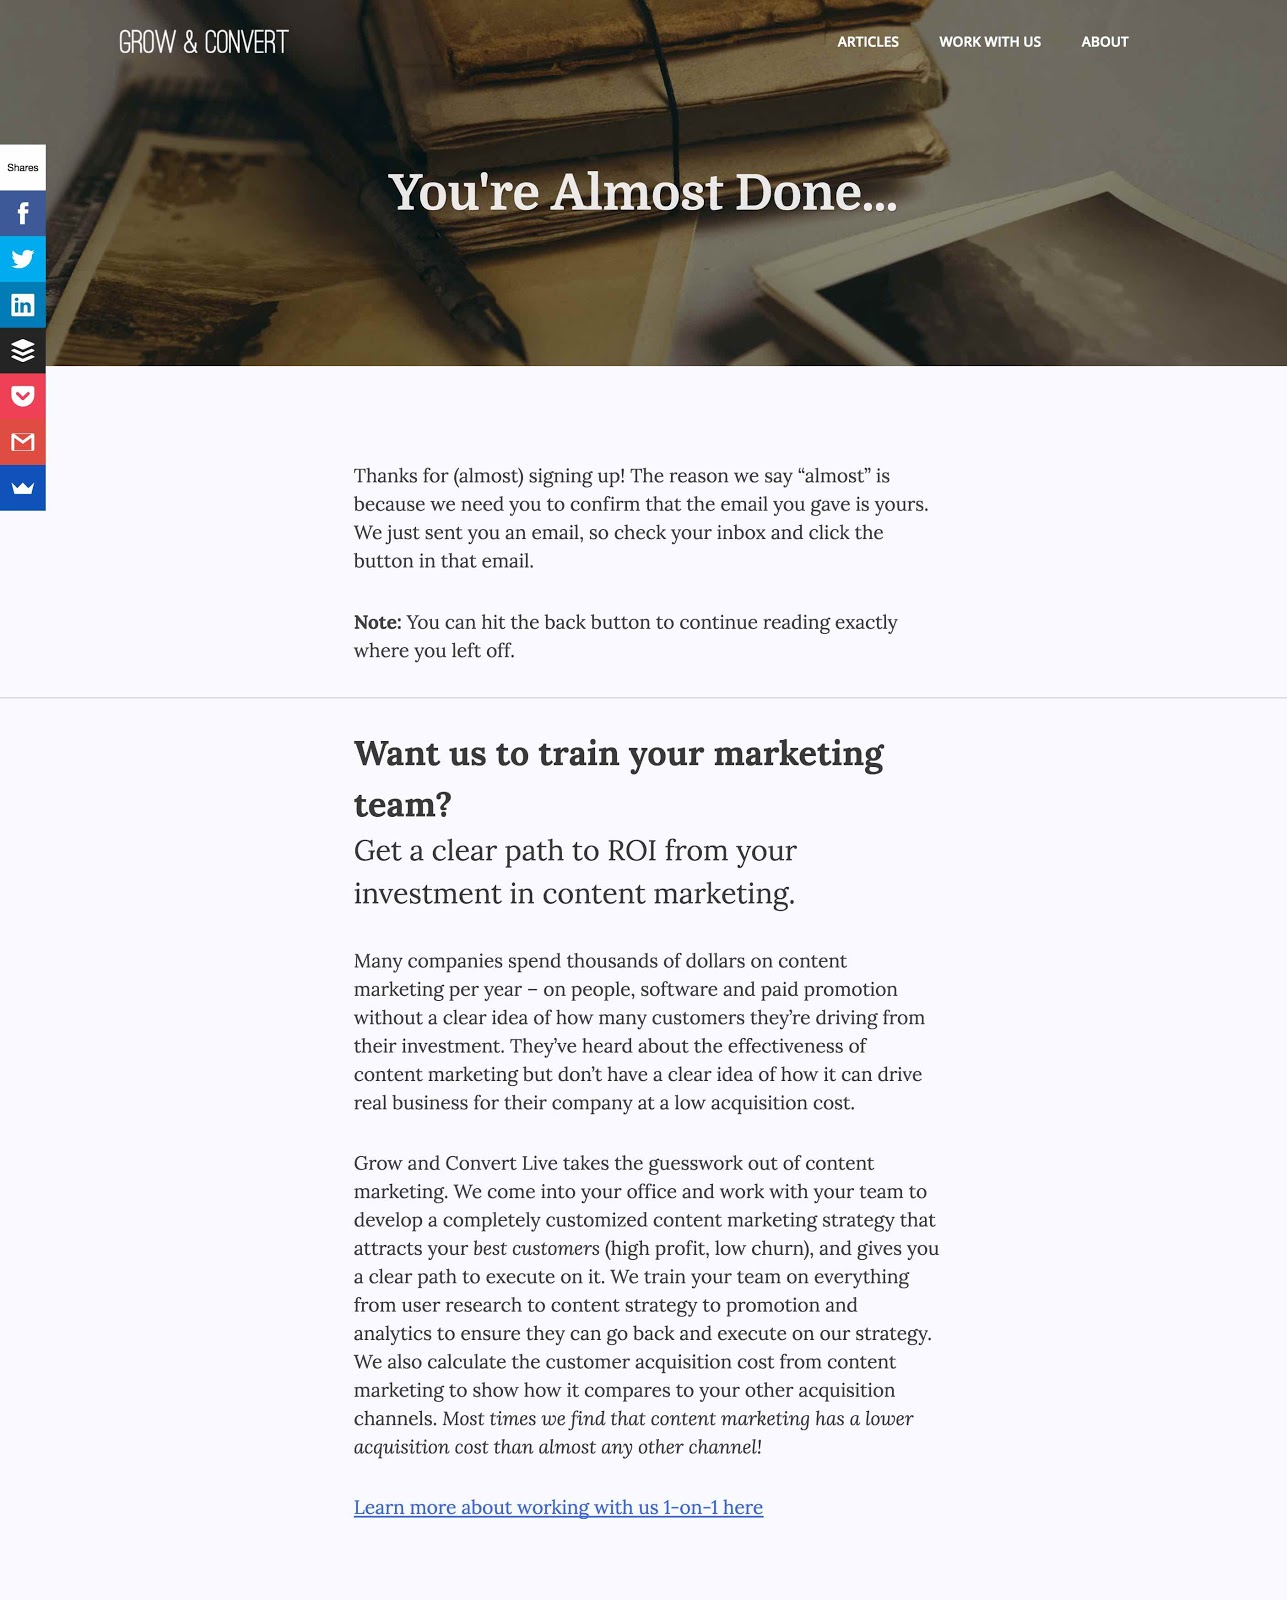
Anyone who reaches that page had to opt in to our email list, you can’t reach it through any other method (that’s why I intentionally did not link to it above and just gave a screenshot).
Step 2: Set this thank you page up as a goal in Google Analytics
Once you have a unique thank you page set up, GA does the rest of the work for you.
Here’s how.
In the end, what you want to know is how many leads came from what sources:
- Content
- Paid media
- Social media
Even more detail within those 3 categories is also useful:
- Content: Which blog posts brought in the most leads?
- Paid: Which campaigns are bringing in the most leads? (at the lowest CAC)
- Social: Which platforms are bringing in the most leads?
- All 3: Which landing pages or calls to action are converting the best?
It turns out GA has already created built in reports that neatly answer questions like the above for you.
For example, look at this landing pages report that shows which blog posts convert the best for G&C:
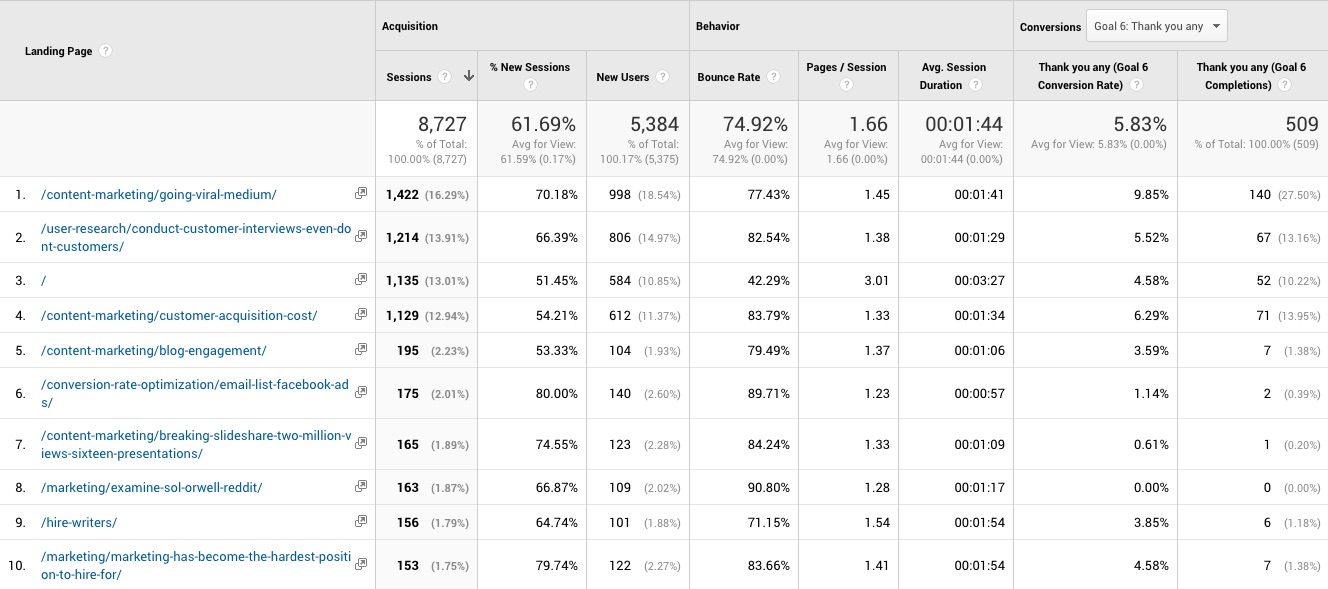
We can see interesting info already, like the fact that our article on going viral on Medium converts way higher than anything else on the site.
All you have to do is set up your thank you page as a goal.
How to Set Up Your Thank You Page As Goal in Google Analytics
This is pretty straightforward, but I made a little video to show how:
Once you do this, you’re in business.
From now on, GA will log how many times users reach your thank you page (a “Goal Completion”), and once it does that, you can use it’s built in reports below to start answering questions about what channels, paths, and pages are most effective at generating leads.
Useful Google Analytics Reports
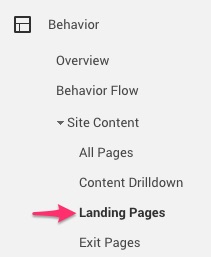
Landing Pages
This report shows traffic and conversions on the pages where users originated on your site, that is, the first page where they landed on your domain.
You can get to the landing pages report here:
Like I showed above, this report is insanely useful for content marketers. Above, we saw that our Medium post converts like crazy compared to others. We can use that information to analyze why and try to replicate that on other high traffic posts.
In this report, you can also use simple search filters to look separately at how pages on your main site (say, Home, Features, Pricing, Case Studies, Product pages) are doing at attracting traffic that converts to leads.
I could go on and on about these GA details, but this article would get too long. We cover these tactics and other GA details in our advanced training. You can also ask me any questions about this in the upcoming webinar, which you can sign up for here.
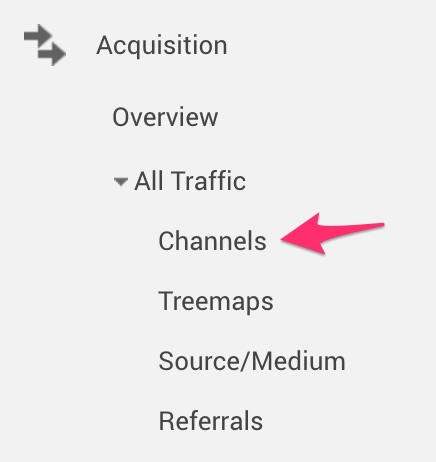
Acquisition Channels
You can get to the acquisition overview report here:
Here you can get a high level view of which channels are bringing in the most leads and converting the best.
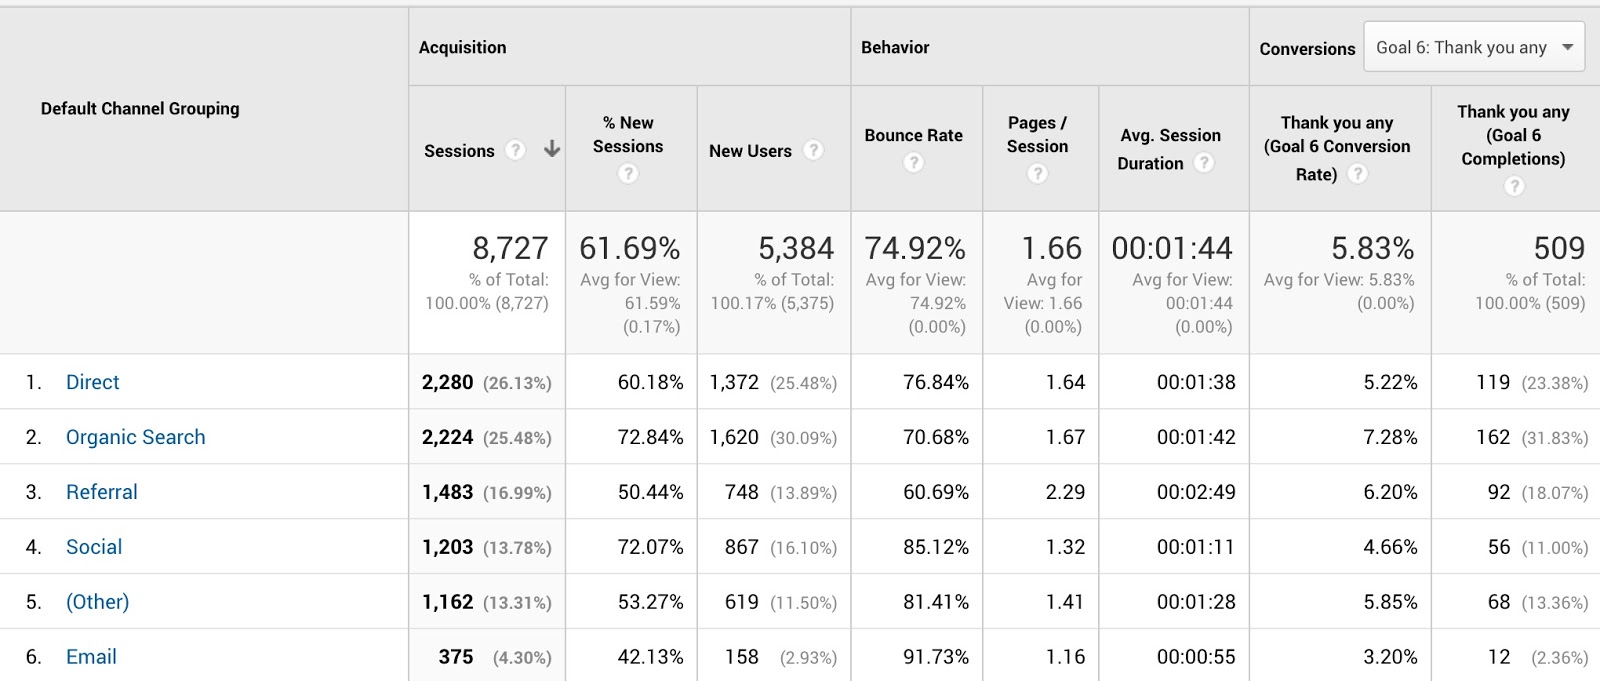
For us, we can see immediately that organic traffic converts the best, and social the worst (I’m excluding email because the majority of that traffic is already on our list).
[su_note]Aside: Think of how useful a simple report like this is if you’re in a management meeting where someone is telling you “We need to invest more in social.” and you want to argue “No, our time and money is better spent on SEO content.” Your persuasiveness in that meeting is dramatically different if you have just this one, simple, ready to project on the screen. The fact that it’s directly in the company’s GA vs. in some obscure format (like some Tableau data or something) gives it even more credibility. [/su_note]
But this is just high level stuff, so let’s dig deeper.
Source/Medium
The source medium report is on par with the Landing Pages report in terms of utility. You can find it in the acquisition section:
This goes one level deeper and tells you where the traffic from various channels actually comes from and how well it converts:
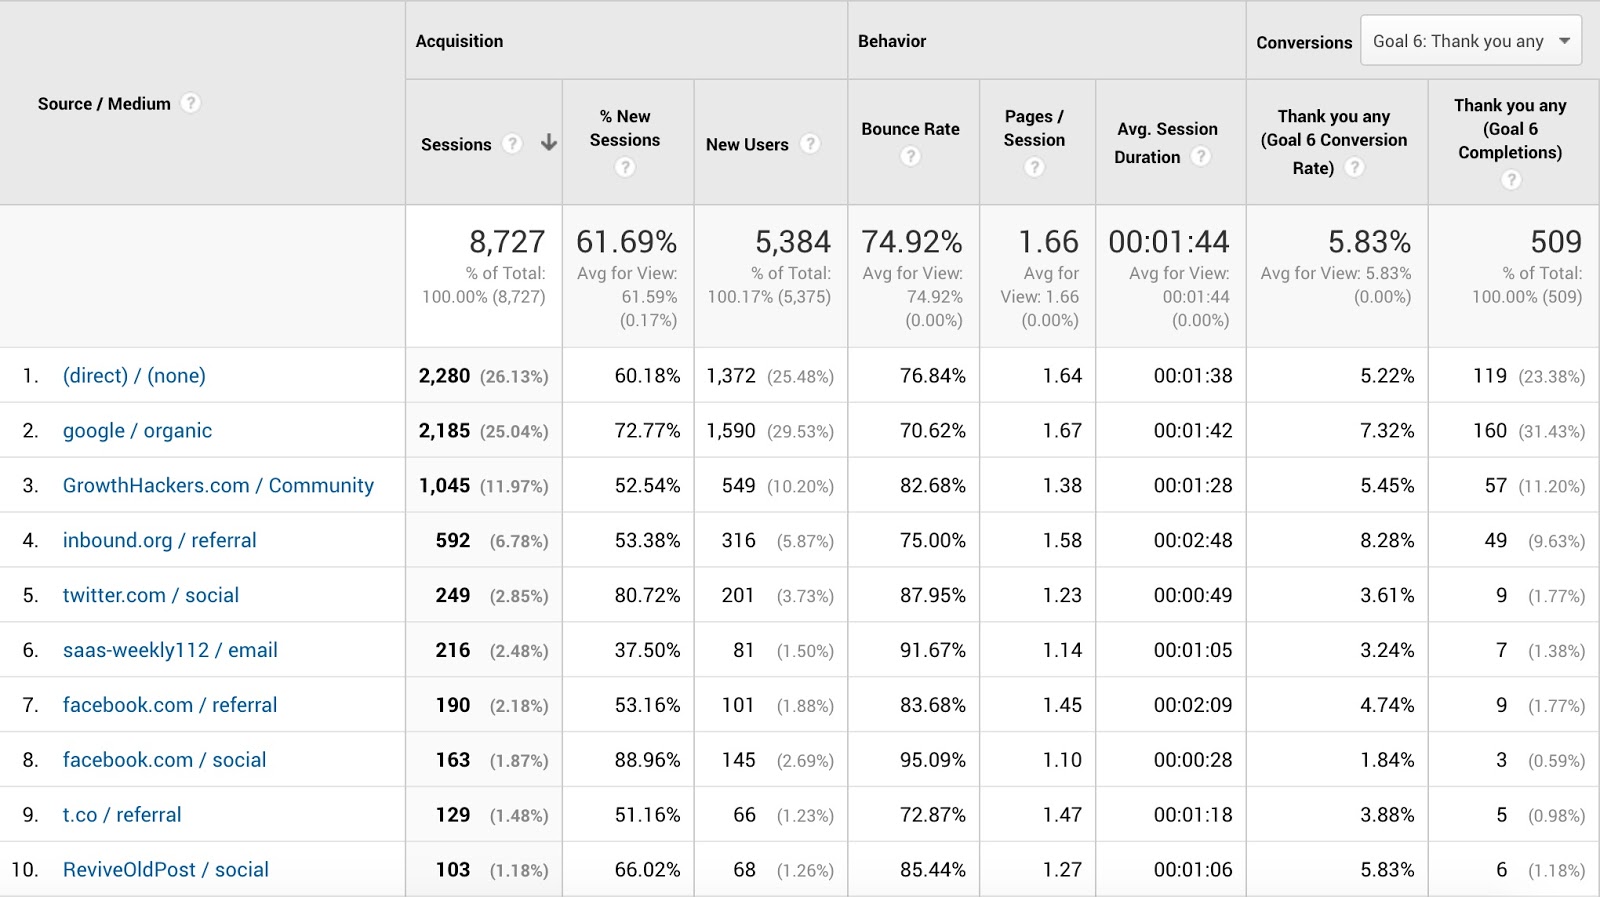
So for example, we can see details like where the bulk of our referral and social traffic actually comes from, and, importantly, how well they convert.
Closing Thoughts on Simplicity vs. Detail
Google Analytics is obviously a very powerful tool that can do a lot more than show just these simple reports, but what we’ve noticed from working with companies to build their content marketing strategies is that simplicity is more important than detail in changing organizational culture to become more data driven.
That is, if you overcomplicate projects like “Let’s measure where leads come from”, it paralyzes the ability to create lasting change.
My initial thinking is that this is due to two reasons:
First, having a complicated process to measure and analyze data reduces the chances that the person in charge of doing this will actually do it.
Second, complication also reduces the chances than other decision makers (e.g. executives) will understand and believe the data and thus make decisions off of it.
So while this thank you page method effectively uses last touch attribution to assign leads to content and other channels, it’s simple. Multi-touch attribution is not so simple (more on this in a later post).
So if your organization already has this down and is data driven to begin with, then moving to a more sophisticated model for attributing leads to different channels may make sense.
But in our experience 90%+ of companies we talk to are not at this level. Most cannot tell us how many leads were generated last quarter from content. This isn’t a dig at anyone, it’s just our observation.
If this is the case, then don’t try to build a spaceship when the bicycle hasn’t been invented yet. Start with something simple, build an organizational habit of tracking the data, and referring to it when making strategic decisions.
Once this is down (for, say, a few months), then move on to fancier methods.
Note: If you’d like to learn how to attribute leads to content with video examples, we also share this process and more, in our course and community.
Video: Google Analytics Goals
Where should we send the link to the video?
Join the Grow and Convert Newsletter
Get our marketing ideas emailed weekly.
Explore Articles By Categories


Explore our Videos