One of the biggest issues we hear from marketers and founders is this:
“We have no idea what our return on content marketing spend is…”
If this is you, don’t feel bad, it’s incredibly common…
- You’re publishing content.
- You’re getting some traffic.
- The posts look good (great images!).
- You’re sending emails.
- People are opening emails.
- Your Twitter follower count is going up!
- Things must be working…
But when the CEO asks “Is this worth it?” or “What’s our customer acquisition cost from content?” you turn into a deer in headlights, and start mumbling responses as your heartbeat goes up:
“Well, I talked to sales, and they say customers are mentioning blog posts, so…”
“Our emails have a 29% open rate, so people are definitely reading…”
“Look, it’s not that simple. Let me explain how brand awareness works…”
You try your best, but inside you’re thinking…
“What the hell is their problem? They just don’t get it. That’s not how marketing works…”
If you’re this marketer, things would be a lot easier for you if you could point to a spreadsheet and say: “THIS is our acquisition cost from content marketing”. It’d be even better if you could also explain the subtleties of how that’s driving which growth campaigns you’ll work on for the next 6 months, what assumptions were made, and whether this is an upper or lower limit approximation.
If you’re the founder or executive, you would feel a lot more confident about your content marketing spend if your employee(s) in charge of content had these calculations done. Your cash and employee time are the two most important resources at your disposal to grow. Is spending them on content worth it?
From what we could find, customer acquisition cost (CAC) from content marketing has not been calculated or dissected thoroughly online. (Which is shocking considering that content marketing is so hot right now).
So, that’s the subject of this article. The basis of this analysis is a spreadsheet model that we built to help you calculate your CAC from content marketing.
[su_note] Getting the Spreadsheet Model: As always, this model is available for free for subscribers to our newsletter. If you’re a subscriber, you can click here to get it emailed to you.[/su_note]On top of just building the model, we also dissect which factors are the most powerful growth levers:
- If blog traffic goes up and down, how much does CAC change?
- If conversion rates from blog posts change, how much does CAC change?
- If you put more or less headcount towards content marketing, how much does CAC change?
Understanding which of these growth levers are most sensitive is critical because it teaches us what factors matter and what factors don’t really matter, so you can focus your efforts on the most important levers to reduce acquisition cost.
You can use the model and the analysis in this post to calculate your own company’s CAC, which means you’ll stop guessing, start measuring, impress your CEO, and figure out how to lower your acquisition cost from content marketing.
Note: I’ll be using the terms “acquisition cost”, “CAC”, and “cost of acquisition” interchangeably throughout this article, but I’ll try to stick to “acquisition cost” to avoid acronym overload.
What is a “good” acquisition cost?
We should first make sure we at least have some idea of what numbers are reasonable for acquisition cost: $1? $100? $1000?
The bad news is that the answer to “What’s a good acquisition cost?” is the ever-annoying: it depends.
The good news is that I can tell you exactly what it depends on.
It depends on the value of a single customer to your company, which is most often represented in two ways:
- Monthly recurring revenue of a single customer: MRR
- Lifetime value of a single customer: LTV
[su_note]Excuse the acronym jungle here, but these are terms people use…when in Rome, you know? [/su_note]
A “Good” Acquisition Cost Compared to Lifetime Value
Many say this defines a good acquisition cost: CAC < LTV.
But that’s a little ridiculous.
If your LTV is $300 and your CAC is $299, you’re making $1 over the life of your customer — not good.
Even if you’re at $250 CAC on a $300 LTV, it’s not clear your business is “good” or even profitable when factoring in all other costs to keep the business running.
Jason Lemkin of Storm Ventures and SaaStr says successful SaaS companies spend 20 – 30% of LTV to acquire a customer.
Ok good, that’s one data point.
If your business isn’t SaaS, your cost structure (and everything else about your business) is likely different, so you’ll have to adjust accordingly. It’s up to your business economics to decide what CAC/LTV ratio is acceptable, or “good”.
But that leads us to the other way to understand if your CAC is “good”.
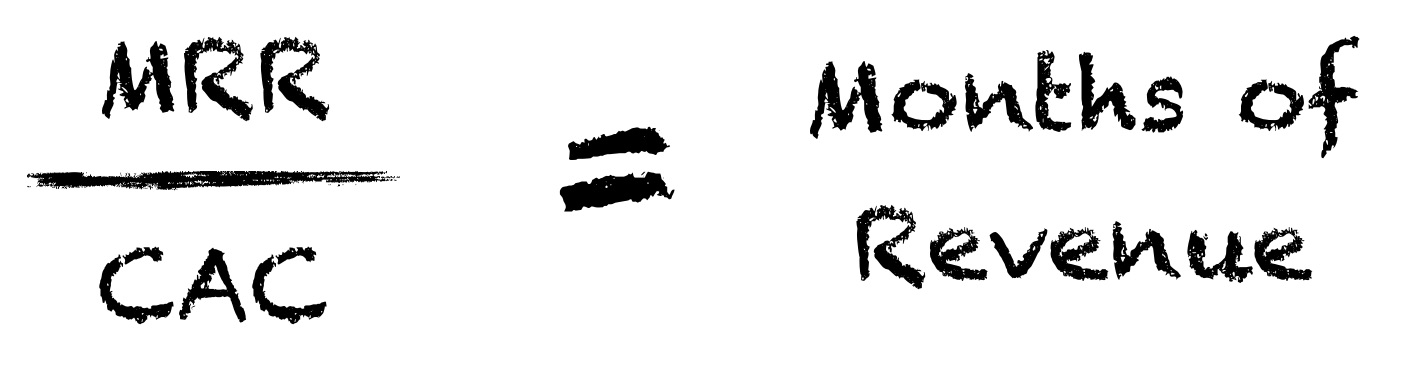
A “Good” Acquisition Cost Compared to Monthly Revenue
This method is more intuitive to me: How many months will it take to make back your acquisition cost? (After that…bring on the profit!)
So what number of months is acceptable to makeup your cost of acquisition?
Various founders and marketers on Quora seem to gravitate to saying 18 months is typical for large enterprise businesses and 6 – 12 months is better for smaller consumer businesses.
The months of revenue you’re willing to spend to acquire a customer is of course a function of how long your customers typically stay a customer (churn rate), but I keep seeing 6 – 12 months for most consumer SaaS and 18 months for large enterprise SaaS.
That means that for our app Wordable, which is $19/month for the paid version, we can spend somewhere between $120 – $200 to acquire a customer and be in this ballpark.
It also means that this ballpark only works if the average customer keeps using Wordable for much longer than 6 – 12 months.
[su_note]Aside: Apologies that my examples are very SaaS-centric, that’s the nature of CAC, LTV, MRR. It’s dominated by SaaS because that’s the most typical recurring revenue business type. But these concepts apply regardless of your business type. If your revenue is recurring, it all applies, and if your revenue is not, you can still know your LTV and use the above section to gauge a reasonable acquisition cost.[/su_note]
So in general I’ve noticed that for self-serve B2C recurring revenue businesses, which presumably charge less than $100 per month, people suggest a CAC between $100 – $500 is typical.
As a final example, Ada Chen Rekhi, cites typical values of SaaS companies at anywhere between $100 – $500, which is consistent with the 6 – 18 month rule of thumb for products in the $10 – $80/m range (roughly).
So with those ballpark numbers in hand (6 – 18 months of revenue), let’s look at calculating acquisition costs from content marketing.
Calculating Acquisition Cost from Content Marketing
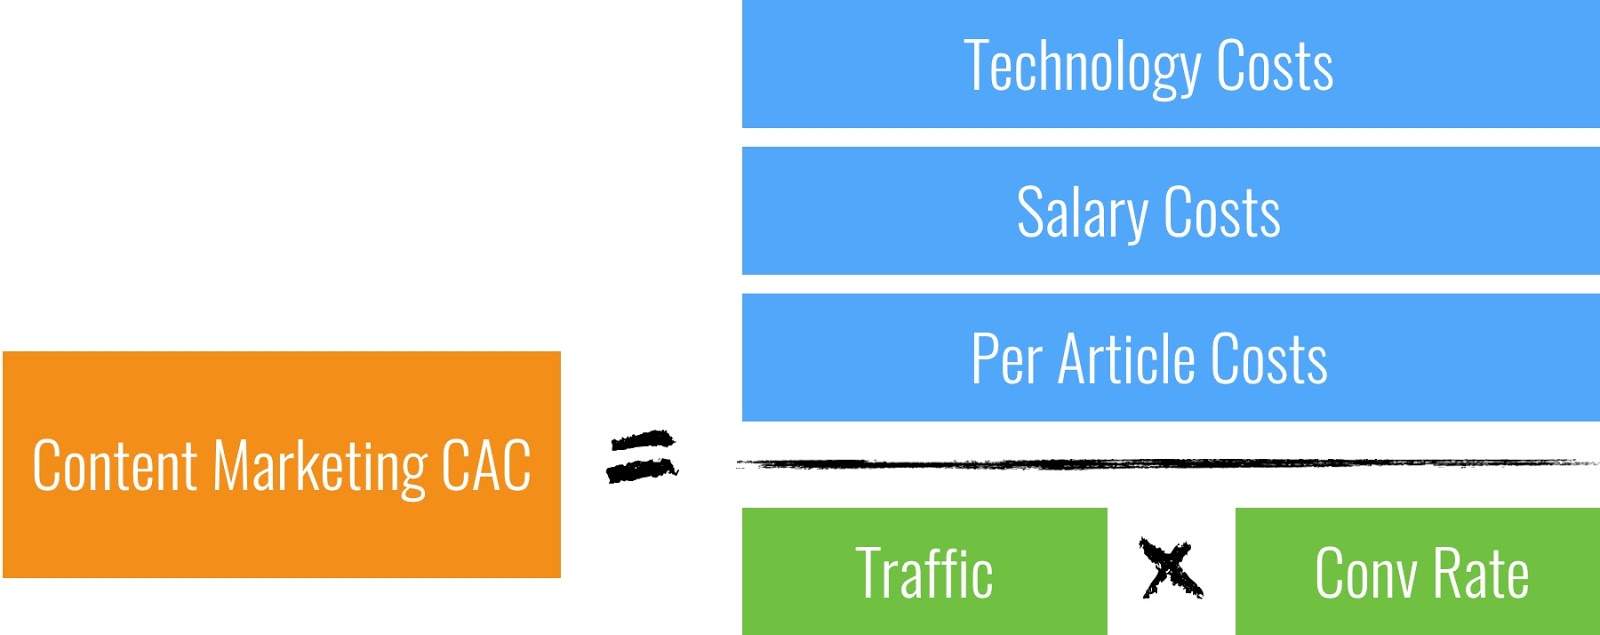
In essence, cost of acquisition is a simple calculation: add up all your costs, divide by number of customers you get from spending that money:
But as always the devil is in the details.
So let’s look at the numerator and denominator separately.
Costs of Content Marketing
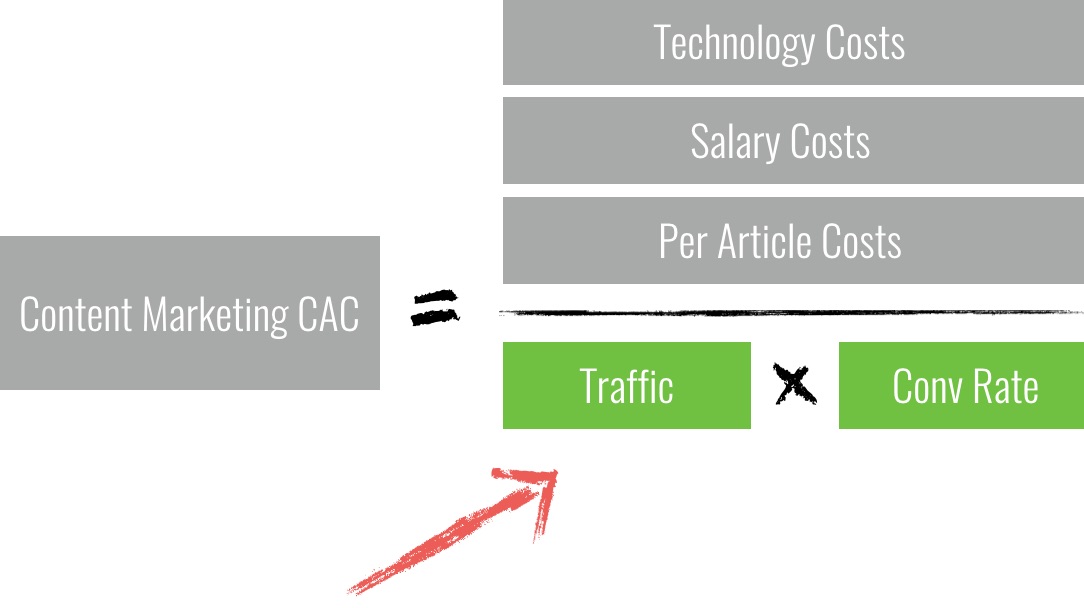
This is the bulk of the work we’ll have to do. I’ve divided up the cost into three categories:
- Costs per article: This includes freelance writer costs, any custom graphics and images per article, etc.
- Salary Costs: Full time employees, developer time, and/or outside agency costs.
- Technology Costs: Email software, opt-in software, and anything else used for content marketing. Like salaries, you can also attribute partial costs here.
In the spreadsheet model, I’ve summed up these costs as monthly costs because most companies think of costs per month, most software bills per month, and our other models (e.g. blog growth, and lead nurturing) output traffic per month, so this is consistent with them.
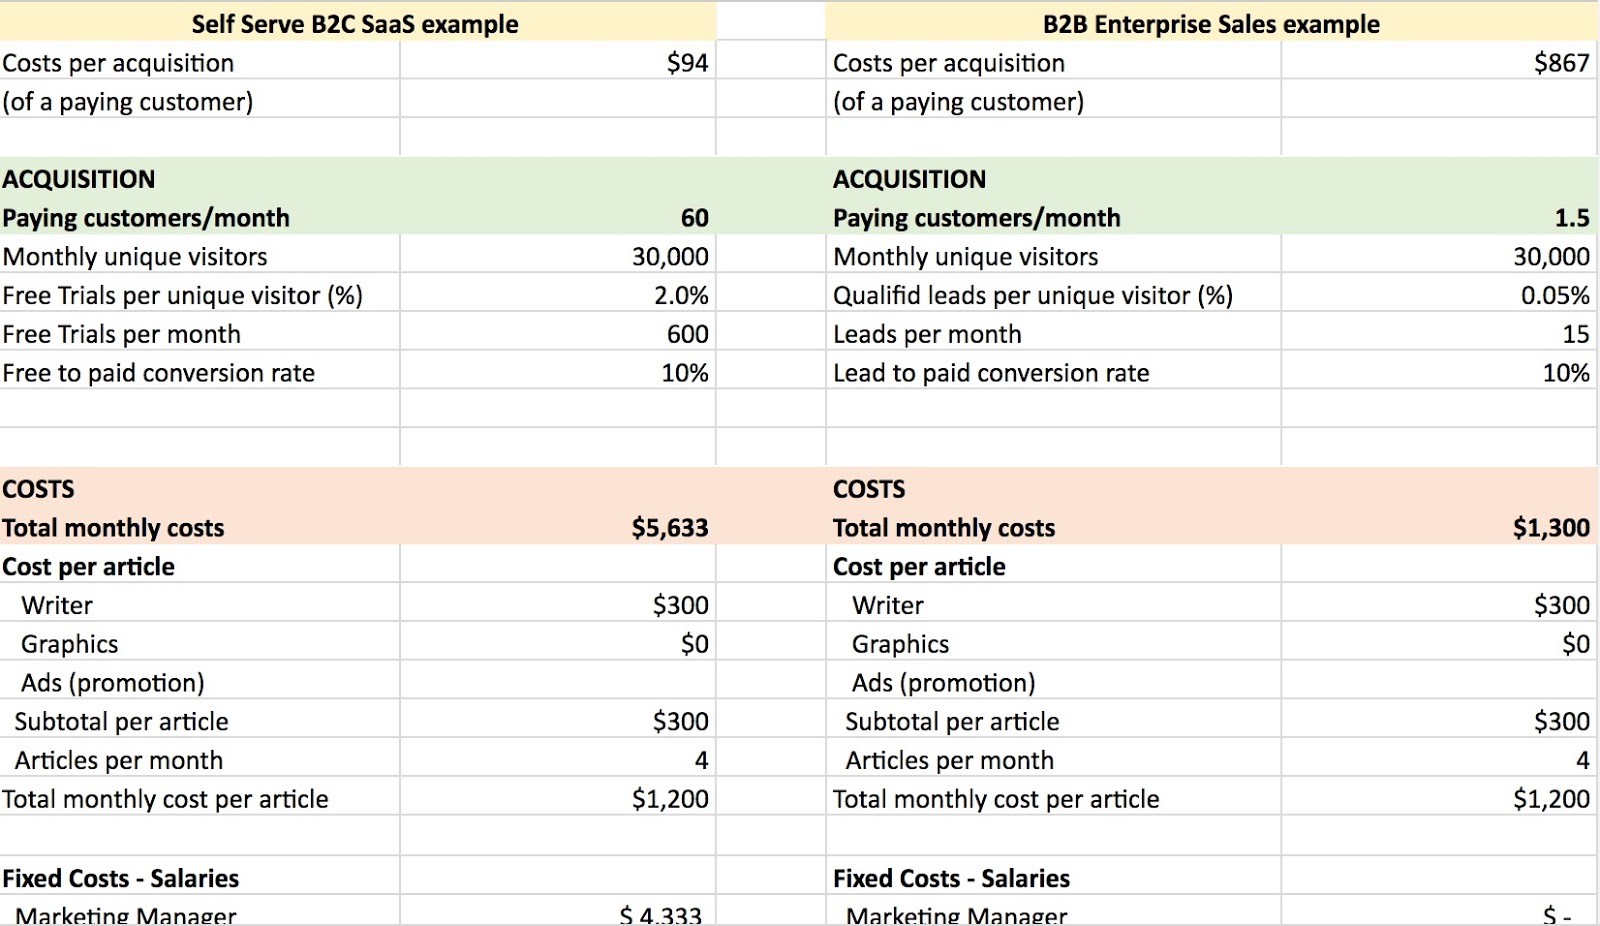
Here’s a screenshot of the top half of the model, where I’ve included two examples businesses at different price ranges:
- Self-serve B2C (lower price, higher conversion rate)
- B2B sales (higher price, lower conversion rate)
Costs per Article
The main cost here is the cost for writers.. So, if your marketing manager (or whoever runs content) writes all of your posts, and you don’t spend money on graphics or any other “per post” expense, then this is zero (hooray!).
In both of my examples above (self serve B2C and B2B sales), I’m modeling the scenario of a company that does outsource article writing to contract writers.
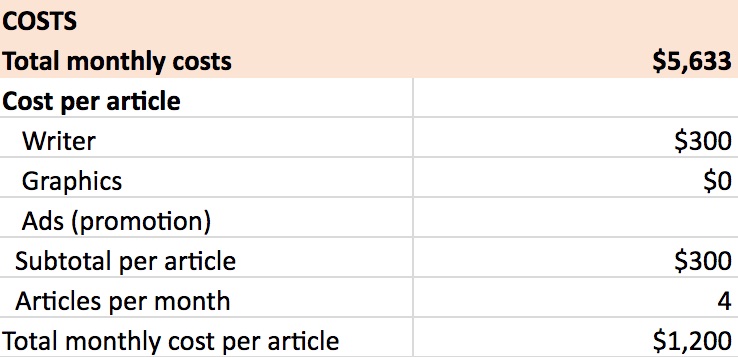
I’ve used a per article cost of $300.
Don’t get hung up on this number in the examples provided, I’m sure it’ll be different for you. It’ll depend on your industry, length of pieces, research required, etc. I’ve heard it can cost as much as $750 (or more) for really good pieces or as low as $100.
If you need help getting started on finding, hiring, and managing freelance writers, we have a detailed guide on that here.
Salaries
Surprise! This is the bulk of your content marketing costs. (Hint: This should not be a surprise.)
In the examples, I’ve modeled a business with one marketing manager that has an $80,000 salary multiplied by 1.3 to account for benefits, taxes, and other expenses to the company. I’m assuming they are spending 50% of their time on content.
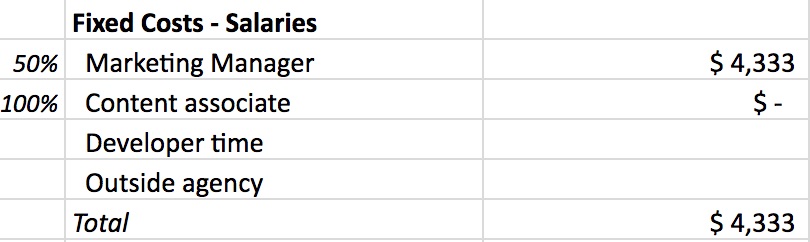
Notice I left placeholders in case you have multiple employees, use developer resources regularly, or pay an outside agency monthly instead of in-house employees.
We’ll look at how sensitive the overall CAC is to this number in the sensitivities section below.
Software
I don’t know what tech you’re using to run your blog, but you can see in the screenshot and in the actual model, I couldn’t figure out how to get this number to be substantive.
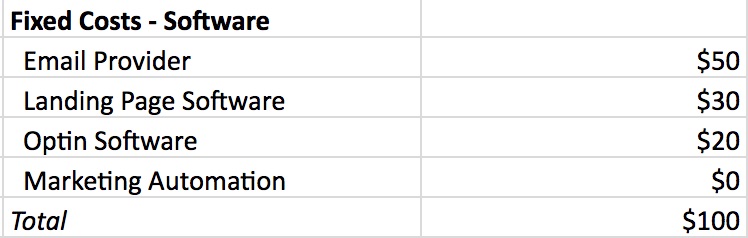
It just doesn’t cost a lot, tech-wise, to run a blog:
- WordPress is free.
- You may be able to attribute 100% of your email service to content but that doesn’t usually cost much.
- Optin software like OptinMonster or SumoMe are also pretty cheap.
- Landing page software like Unbounce or LeadPages are also pretty cheap relative to salaries (and are usually used for a lot more than just content marketing — specifically, paid ads).
Note: None of these links are affiliate links, we’re just citing popular apps we know.
The only way this category can make a big dent in your content marketing budget is if you use an expensive inbound automation tool like HubSpot or equivalent. If you use this or have thought through the ROI on such software, please let us know in the comments, we’d love to understand your reasoning.
Even then, these “automation” tools are maybe $1500 – $2500 a month, so it’s still significantly less than the cost of humans.
All in all, this means if any of the small tools save your marketing manager time, that’s a tradeoff you should be making.
This means tools like our very own Wordable.io that save your marketing manager hours a month and costs only $19/month are very, very worth it. (Ok, I’ll stop repping Wordable, I promise…)
Leads Acquired from Content Marketing
Remember, CAC is costs divided by acquired customers, so now let’s talk about the latter.
I’ve modeled this using two conversion rates since this is how most funnels from content work:
- Traffic to your blog.
- Conversion to leads (fill out sales form, request demo, start free trial, etc.).
- Conversion from leads to paying customer.
You just multiply these three numbers together and the end result is the number of acquired customers from your blog traffic.
(Use unique visitors [in GA, this is now called “Users”)] per month for traffic, percent of unique visitors for conversion to leads, and percent of leads that convert to paid.)
Now, most content marketers get hung up on two things when doing this calculation. Let’s discuss each issue.
Issue #1: “How do I know how many leads my blog generates?”
This is the subject of an entire post on its own, but quickly, the easiest way to do this is to have a very clear “success” page when a user becomes a lead. For example, if they fill out a form to talk to a sales person, join an email list, or start a trial, make sure they get sent to a unique success, thank you, or onboarding page.
Set that page up as a goal in Google Analytics (GA), and the GA Landing Pages report will tell you how many people got to this thank you page from where they landed. Use that to count up how many thank you page hits came from the blog. For example, here it is for Grow and Convert:
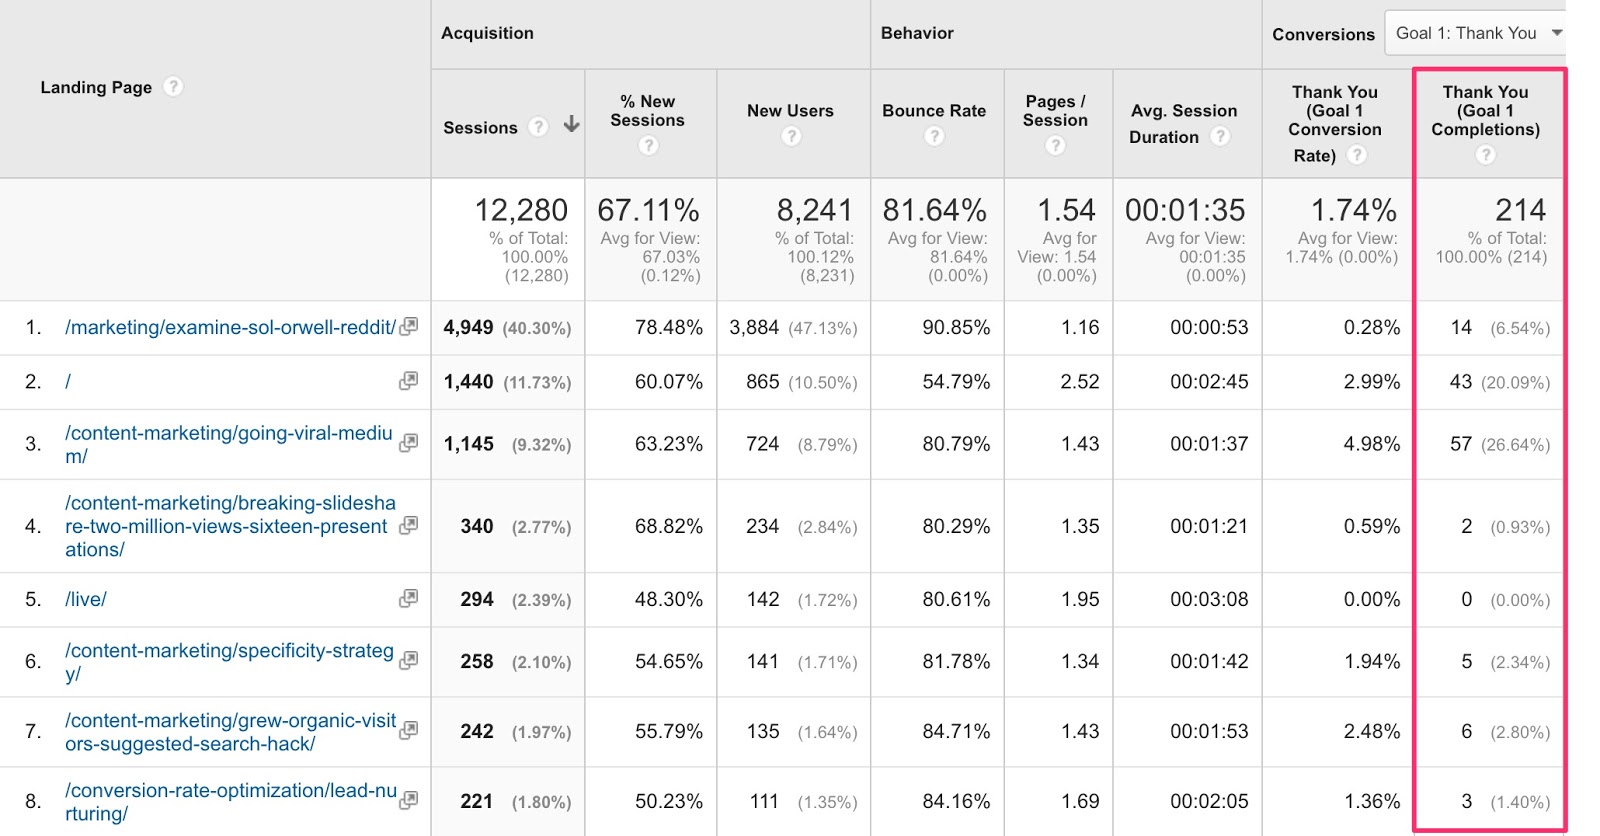
[su_note]Note: Since the introduction of Google Analytics 4, our process for measuring leads from content has changed. Read our post on how to set up and track conversions in GA4 for the most up to date tutorial on how we do this at Grow and Convert.[/su_note]
Issue #2: “But our content helps various customers convert over long periods!”
This is the trickier issue.
Basically the argument I hear is:
Look, the leads we get from content aren’t just people who signed up for a demo right when they read a single blog post- that number is almost zero. We email prospects posts over time, they may have to read our stuff for months or years before they convert, it has overall brand benefits, etc.
First things first, if content is only used as a “brand building” endeavor, this model and post isn’t for you. For example, how is Pepsi going to figure out how many sales they get from their ads in soccer (excuse me, futbol) stadiums across the world.
(It’s actually not impossible, but requires much more complex experiments.)
If content is used in your company like that Pepsi ad in a soccer stadium, you’re not going to be calculating CAC anytime soon.
But those extreme situations aside, I suggest for the sake of starting somewhere, to effectively use last click attribution here and count anyone who “signs up” from a blog post as a lead.
Yes, that doesn’t give you credit for leads that first heard about you from a blog post but later converted on some other page after they were already familiar with your brand.
Yes, that doesn’t give you credit for a lead that converted to paid because of credibility built from great blog posts you emailed them over time.
But these issues can be dealt with, even if they are too complex to discuss all in this one blog post, and using last click attribution lets you start somewhere, which is better than having zero insight into content marketing CAC (which is most common).
So start with last click attribution, and just keep in mind that you are computing an upper limit to content marketing’s CAC.
Come armed to a meeting with this argument:
“CAC is even lower than this, because I’m not even counting other ways that content is generating sales for our company!”
Back to Our Simple Lead Attribution Model
So those two issues notwithstanding, the acquired customers portion of our model is pretty simple:
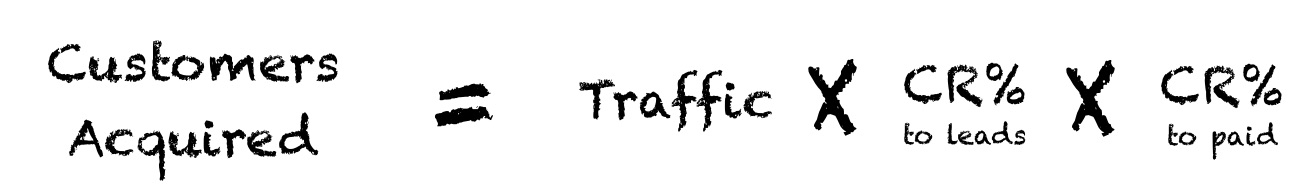
That means the number of customers acquired is linearly dependent on all three factors above, equally.
In other words, improving the conversion rate at either step by a factor of two is equivalent to doubling traffic.
For example, 10,000 monthly uniques at a 1% overall conversion rate is the same number of paying users as 5,000 monthly uniques times a 2% overall conversion rate.
So, traffic and your conversion rates are all strong levers that can move your content marketing CAC…by a lot. Keep this mind.
Speaking of levers, let’s get to the fun part: Which factors matter, and which don’t?
Growth Levers: Which factors matter, and which don’t?
We’ll start by checking off the least important levers (not sensitive) and work our way up to the ones that affect CAC a lot (highly sensitive).
In the spreadsheet, I have two example scenarios modeled: (1) A B2C “self-serve SaaS” company with a free trial model (think: Buffer) and (2) A B2B enterprise company (think: an agency)
For these sensitivities, I’m using the B2C self serve model as a baseline. (It doesn’t really matter, I just chose this.)
Promotion Spend Per Article: Not that sensitive
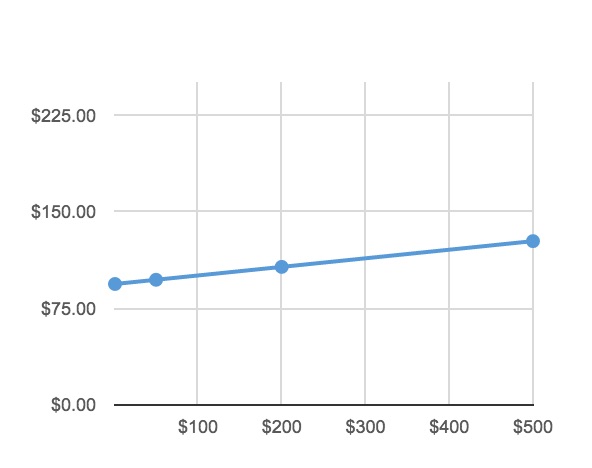
I changed the spend per article from $0 to $500. That changed the CAC from $93 – $130. Not a big deal.
Lesson: If spending money to promote each article helps improve traffic, spend that money. We’ll see later that traffic moves the CAC needle a lot.
Writing Costs Per Article (or Articles per month): Not that Sensitive
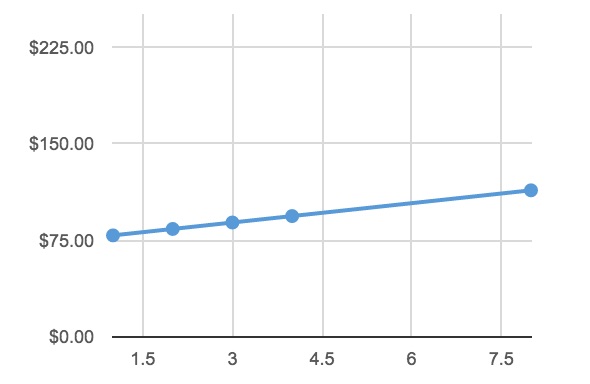
I changed the number of articles produced per month from 1 to 8, which changed the monthly expense on contract writers to produce the content from $300 to $2400 per month.
This changed the CAC from $78 to $113. Not a big deal.
Lesson: If producing more articles per month can get you more traffic (without reducing quality), spend the money on hiring freelance writers to get it done.
Salary Costs: Pretty Sensitive
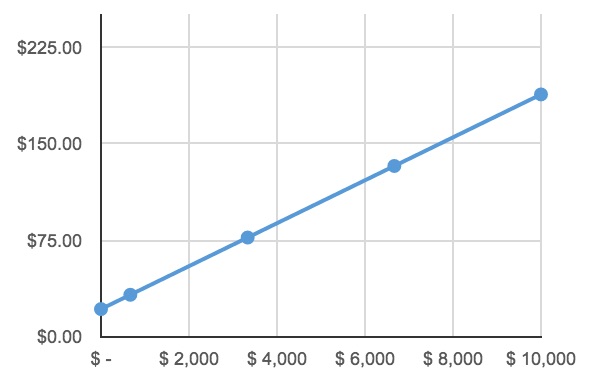
I changed the monthly spend on full time employees from $0 (e.g. the founders do all of this themselves) to $10,000/month. This changed CAC from $20 to $180.
That’s a big range. As I said above, people are expensive.
Note: I just stopped at $10k because as you see above the dependence is linear. You could use $50k, for example, to model a scenario of a multi-person in house writing staff and CAC will still just go up linearly.
In particular, the low end of this graph is very interesting…
If you’re a solopreneur or startup founding team building a company while you have jobs or somehow are funding your own salary outside of the business, building a blog that draws steady, consistently converting traffic is a home run.
At the beginning, we learned that $100 – $500 was a typical CAC for B2C self serve SaaS type of companies. A blog that gets your customers at $20 is an awesome unfair advantage.
Warning: This is also not easy.
[su_note]Observation: This is also why there is a trend of serial entrepreneurs and online personalities maintaining a personal blog and email list as they launch various separate businesses. Because when they start a new project, they have a built in audience to “launch” to. This is an unfair advantage. It can take years to build this, but it can pay off handsomely. [/su_note]
Traffic and Conversion Rates: Very Sensitive
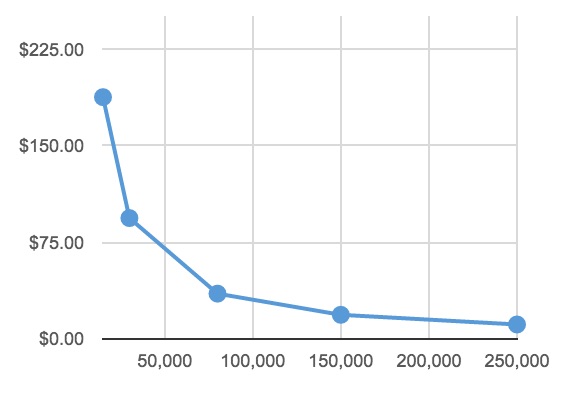
Above I’m showing just the traffic graph but the conversion rate graphs have the same shape. You can get all of them in the free spreadsheet model, and I’ll go over all of them in the webinar. Click here to get a link to both.
In particular, when traffic or either of the two conversion rates is low, increasing it dramatically reduces CAC. Then as traffic or conversion rate gets very high, the CAC, expectedly, asymptotes to zero.
Some caveats, though: Remember, for sake of simplicity that I’m varying one thing at a time. So the above graph shows what happens to CAC if you increase traffic and nothing else changes.
In “real life”, of course, this rarely happens. In particular, these two factors likely will change as you grow traffic:
- Conversion rates will probably dip.
- You may hire more people to pull off a long term significant traffic increase.
Related reading: What SEO Keywords Convert the Highest? (Analysis)
What about other specifics related to MY business?
I can’t cover all what if scenarios in a blog post, but if I had a chance to sit with you and play with the model, I could show you how to use it to get estimates on your various what if scenarios and more.
That’s why I’m following up this post with a webinar to walk through
- How to apply this model to different business types
- What to do even if you don’t know a lot of these values yet
- How to setup analytics to get a simple measure on leads generated from a blog
You can get a link to this webinar happening later this week and the link to the model itself (so you can make a copy and use it for your own business) below. Both are free to newsletter subscribers. If you’re not on the newsletter just enter your email and you’ll be added automatically and we’ll send you the links.
Click here to get a link to the model and the webinar.
Learn More About Our SEO and Content Marketing Agency
- Our Agency: If you want to hire us to execute a content marketing strategy built around driving lead generation and sales, not just traffic, you can learn more about our service and pricing here. We also offer a PPC service for paid search, which you can learn about here.
- Join Our Content Team: If you’re a content marketer or writer and would love to do content marketing in this way, we’d love to have you apply to join our team.
- Our Content Marketing Course: Individuals looking to learn our agency’s content strategy and become better marketers, consultants, or business owners can join our private course and community, taught via case studies, and presented in both written and video content formats. We include several details and examples not found on this blog. Our course is also built into a community, so people ask questions, start discussions, and share their work in the lesson pages themselves, and we, along with other members, give feedback. Learn more here.
Content Marketing CAC Spreadsheet
Where should we send the spreadsheet model link?
(We'll also send you a link to the webinar where Devesh will walk through the model for different business types, in case you want to attend.)
Join the Grow and Convert Newsletter
Get our marketing ideas emailed weekly.
Explore Articles By Categories


Explore our Videos