With the sunsetting of Universal Analytics (UA), many of our clients have been asking about conversion tracking in Google Analytics 4 (GA4). Specifically, they want to know if we’ve set it up yet and what process they should follow to set up conversion tracking in their Google Analytics accounts. So, we decided to write a step by step tutorial on how to do this.
While most articles on GA4 conversion tracking focus on the relatively basic step of setting up conversion events, the events alone aren’t enough to really understand your site’s conversions and what’s leading to them. For that, you need to build and understand reports.
So, in addition to showing you how to set up conversion events this article will also cover: (a) how and why you should leverage multiple attribution models to get a more holistic view of your conversion data, and, (b) how to access and create reports to track and analyze your conversions.
Below, we cover:
- Part 1: Set Up Conversion Events in GA4
- Part 2: Consider Which Attribution Models You’ll Use in Your Reports
- Part 3: Access and Create the Reports to Track Conversions
If you want help setting up conversion tracking in GA4, you can reach out about that here.
Part 1: Set Up Conversion Events in GA4
In UA, Google Analytics conversions were typically tracked by setting up what were called conversion goals. Conversion tracking in GA4, however, is exclusively based on Conversion Events.
Here’s step by step instructions on how to set these up:
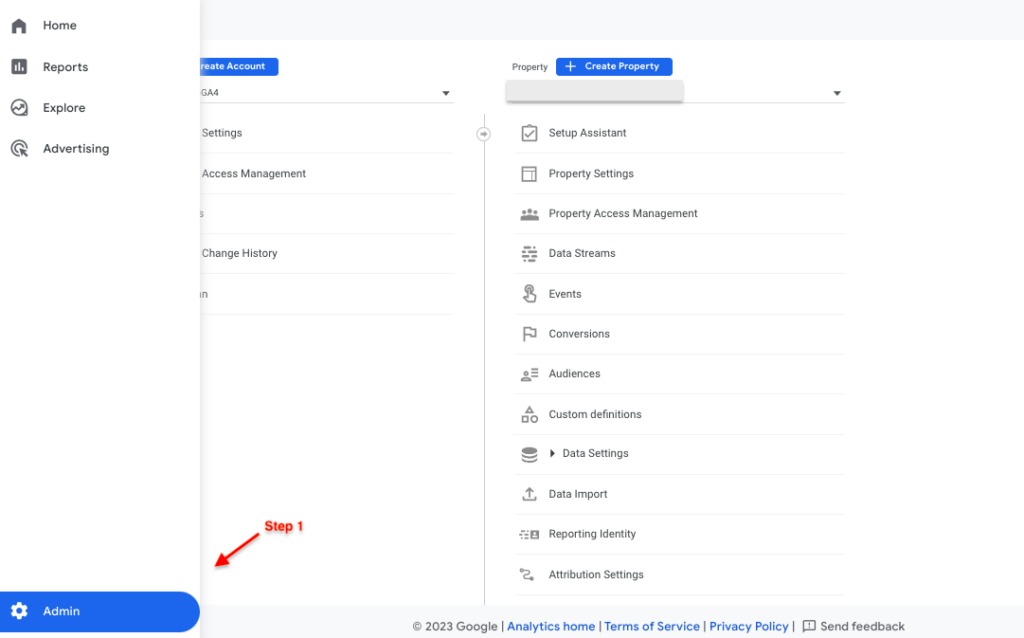
Step 1: Select Admin in the bottom left corner.
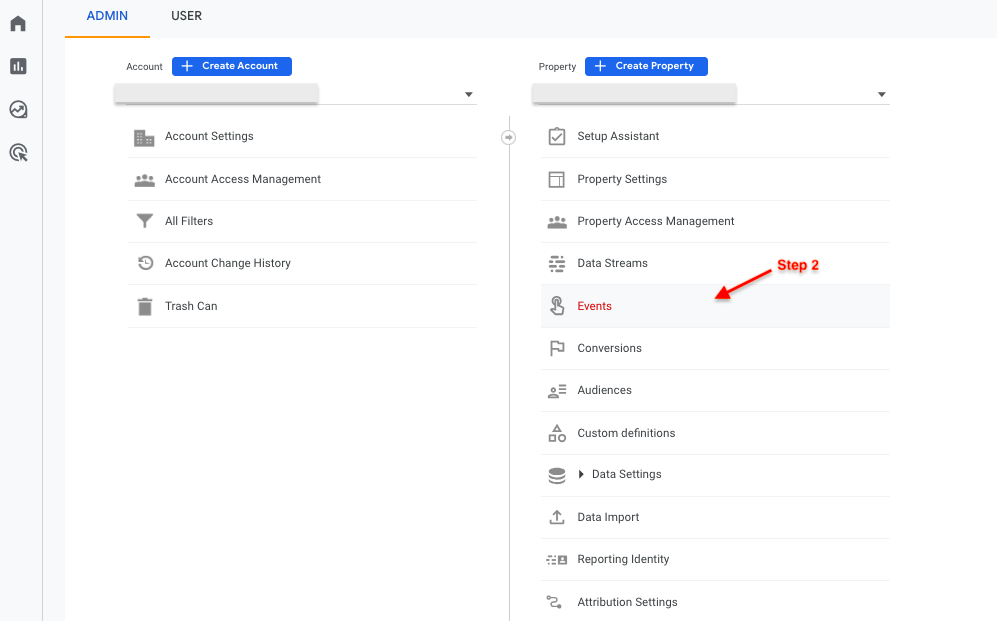
Step 2: In the GA4 Property column, select Events.
Step 3: Select Create event.
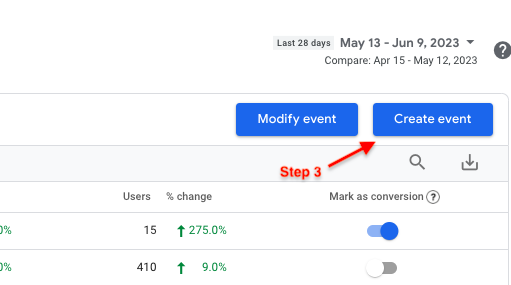
Note: GA4 automatically creates existing events such as page_view events, scroll, click, etc. However, to measure other specific metrics as conversions, you need to create a new event.
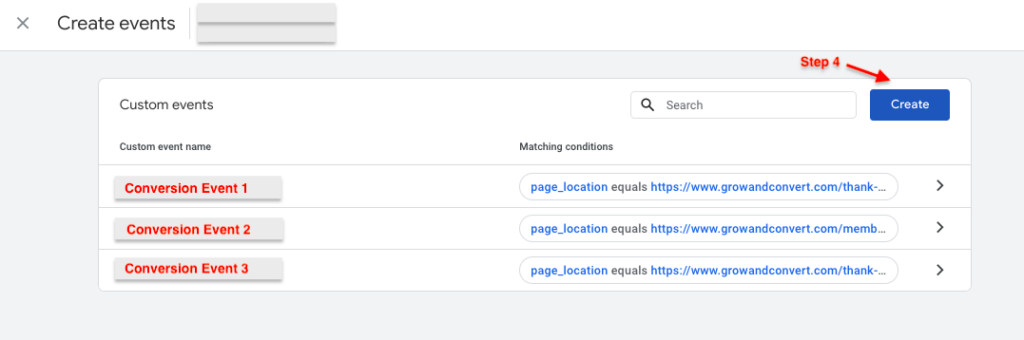
Step 4: Select Create.
Step 5: Fill out the Configuration form.
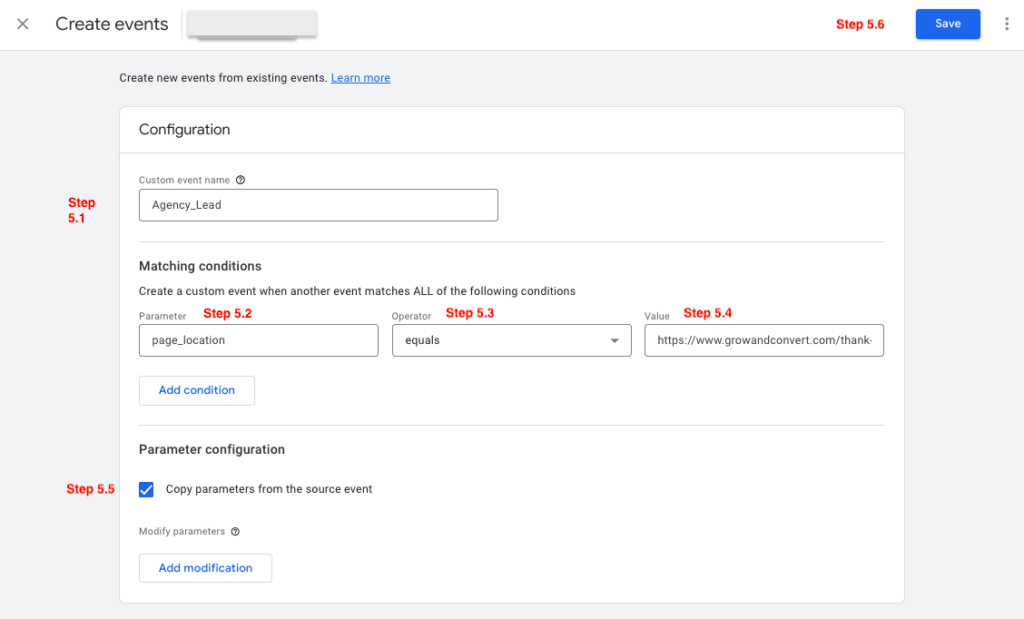
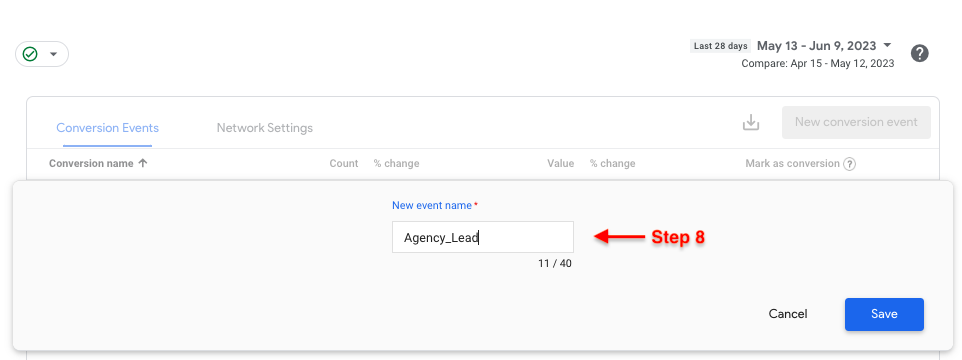
5.1. Define your Custom event name. This name is what you will use to designate this event as a conversion in step 8. The standard format for this is to use an underscore between each word. For example, we use “Agency_Lead.” A SaaS business might use “Demo_Signup,” an ecommerce business might use “Product_Purchase”, etc.
5.2. Select an event Parameter. There is a dropdown list of defined parameters that you can choose from. In our case, we use “page_location” because we want to track when a user lands on a specific page: our “Thank You” page after completing a form submission.
5.3. Select an Operator. For example, “equals” or “starts with”.
Note: Using “Equals” requires exactly matching what’s pasted in the following field titled Value (in our case a URL) for the event to count. So, it may be a safer choice to use “Starts With” which will include people that have UTMs (such as from Calendly) attached to their landing page.
5.4. Define a Value. In our case, the URL of our “Work With Us” thank you page.
5.5. Leave the Copy parameters from the source event box checked.
5.6. Click Save.
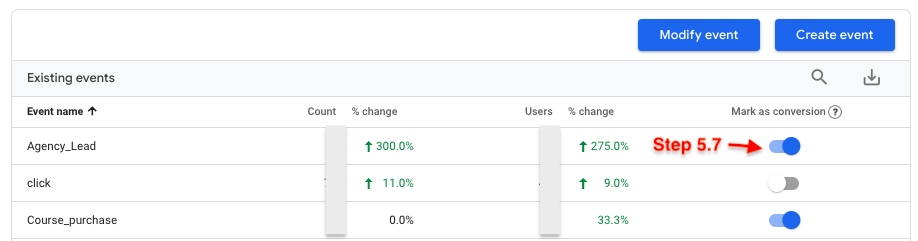
5.7. In the right hand column of the new event you’ve created, ensure the Mark as conversion setting is toggled to the on position.
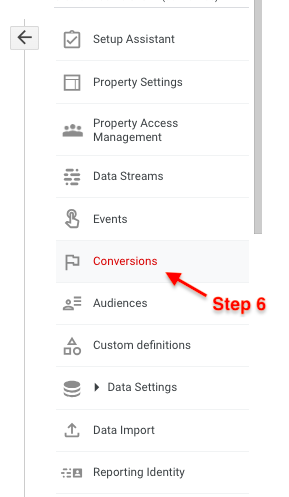
Step 6: In the Property column to the left, select Conversions (underneath Events).
Step 7: Select New conversion event.
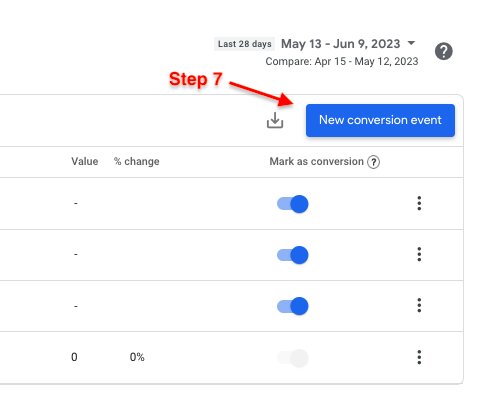
Step 8: Type in your New event name. This must match the exact Event name that you selected when creating your conversion event in step 5.1. And, click Save.
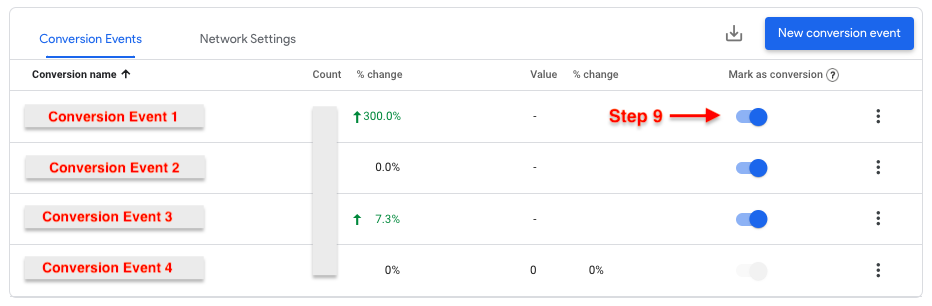
Step 9: In the right hand column of the new conversion event you’ve created, ensure the Mark as conversion setting is toggled to the on position.
Once you’ve completed this step, your conversion event is set up to begin tracking. You can repeat this process for any other conversion events you want to measure.
Now, this is where most articles on setting up GA4 conversions stop. But the next part of the process — choosing attribution models and setting up reports — is what you need in order to functionally track those conversions.
The reports you use, and more specifically, the attribution models you choose that determine how your conversions are counted, matter a lot. No single report or attribution model will give you a complete and accurate view of your conversion data, but setting up multiple reports that use different models can at least get you closer to understanding what your actual conversion data is.
So, before we explain how to access and set up reports, we need to briefly discuss the attribution models that are available in GA4.
Alternatively, we created this video that walks through both attribution models and how to set up the conversion tracking reports if it’s easier for you to watch rather than read:
Part 2: Consider Which Attribution Models You’ll Use in Your Reports
Attribution is the act of assigning credit for conversions to different ads, clicks, and factors along a user’s path to completing a conversion. An attribution model is a conversion counting method which can be a rule, a set of rules, or a data-driven algorithm that determines how credit for conversions is assigned to touchpoints on conversion paths.
There are three types of attribution models available in the Attribution reports in Google Analytics 4 properties (which you can learn more about here):
- Paid and organic rules-based models
- Google paid channels rules-based model
- Data-driven attribution
By default, GA4 uses data-driven attribution, which uses machine learning algorithms to distribute credit for conversions based on data for each conversion event. It’s different from the other models because it uses your account’s data to calculate the contribution of each click interaction.
In theory, this could provide more accurate conversion attribution compared to rules-based models. However, there are some potential drawbacks to consider with data-driven attribution:
- Drawback #1: We don’t know exactly how these algorithms work, so we don’t know how they’re deciding which channels or pages get which conversion values. You can read how Google describes their data-driven model here, but their explanation is esoteric and hard to understand. You’re left to sort of blindly trust that the algorithm is giving you accurate numbers. It’s not as concrete as rules-based models.
- Drawback #2: Depending on how many events occur on your site in a given month — which by default includes all of GA4’s automatically created events like scrolls, clicks, page views, etc. (small actions that can easily add up on many sites) — the algorithms will provide conversion numbers based only on a sample of your data as opposed to your raw data, which can also potentially skew your conversion numbers.
For these reasons, we think relying on data-driven attribution models alone is risky and insufficient for understanding your true conversion numbers.
So, in addition to explaining how to access GA4’s default conversion report below (which uses data-driven attribution), we’re also going to discuss the custom, rules-based reports we’re using at our agency to report on conversions to our clients (essentially recreating the reports we’ve been using for years in Universal Analytics, as outlined in this past article on content attribution).
Note: You can change your default attribution model by going to Admin> Attribution Settings. This would change your reports to default to whichever attribution model you choose. However, we have left our default setting as data-driven attribution, and are simply using custom reports (explained below) with other models to get the most accurate picture we can.
Part 3: Access and Create Reports to Track Conversions
Access GA4’s Default Conversion Report
GA4 automatically offers a conversion report called Conversion Events by Name. Here’s how you can access it:
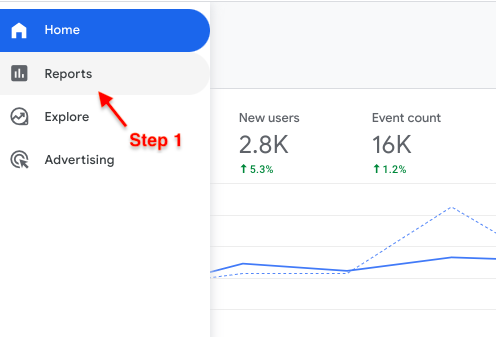
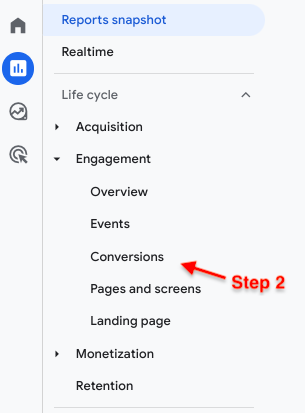
Step 1: In the left sidebar menu, select Reports.
Step 2: Go to Life cycle > Engagement > Conversions.
This page displays two graphs and a table that provide a high-level overview of how your various conversion events are performing, which you can view by date range.
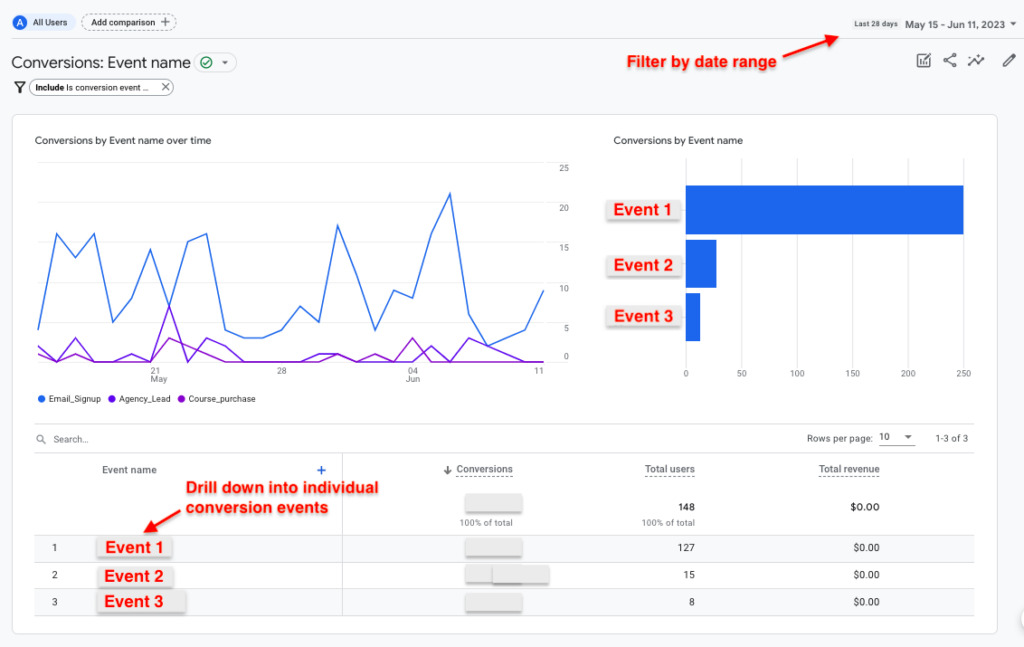
In the table under Event name, you can click into individual conversion events to drill down and view data for that specific event.
This will display conversions for that event by Default channel group, which allows you to answer one of the key questions that most businesses want to understand when looking at their data: which channels are driving the most conversions?
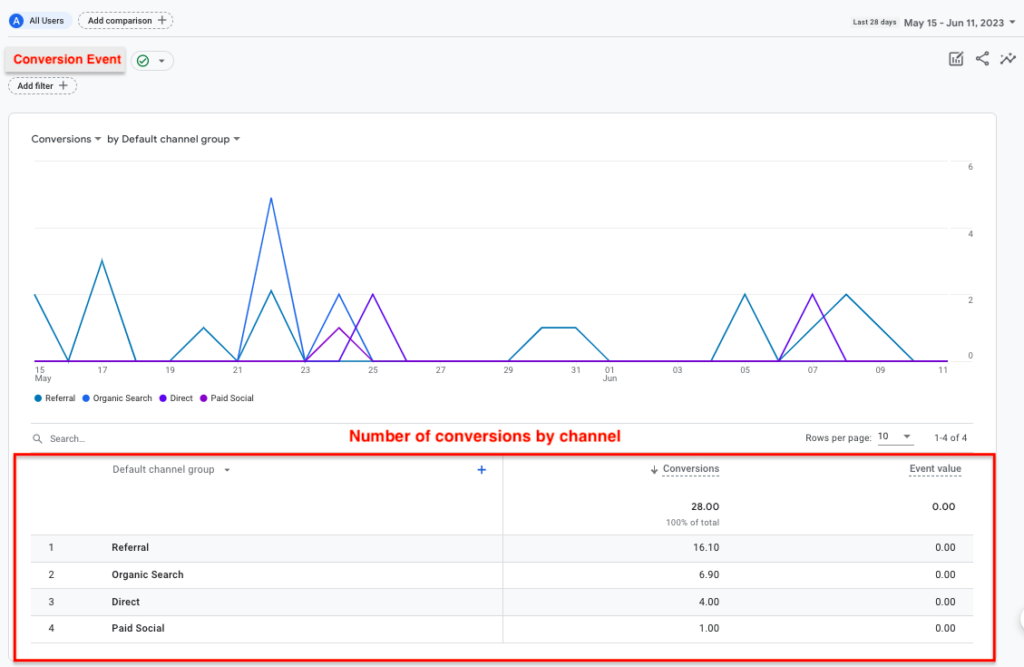
You can also adjust the table to view conversion data by Source, Medium, or Campaign, by adjusting the drop down menu at the top left of the report table.
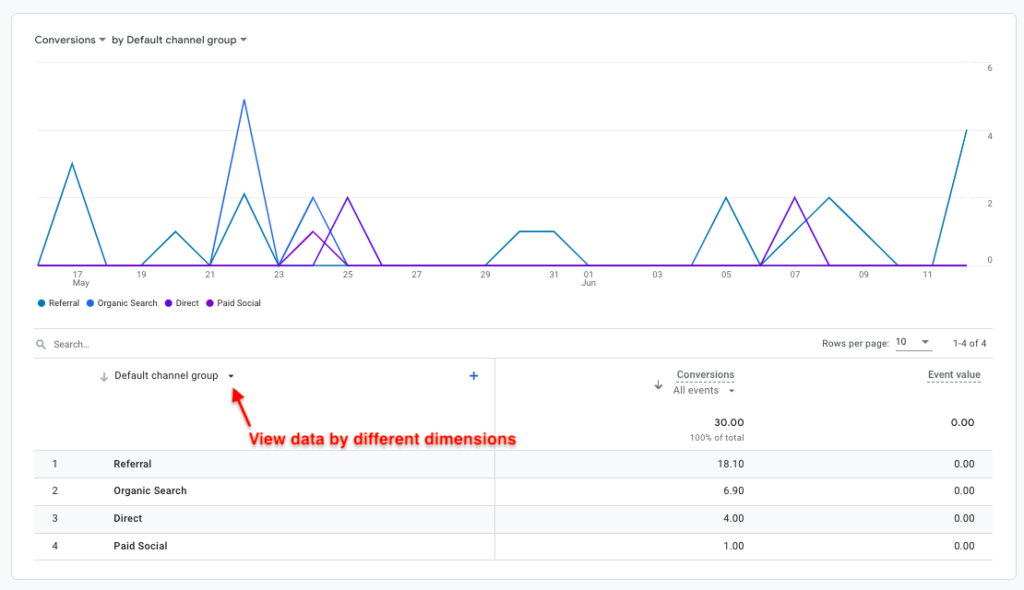
For further detail, you can add a secondary dimension by clicking the plus sign on the top right of the left column and selecting from the dropdown menu.
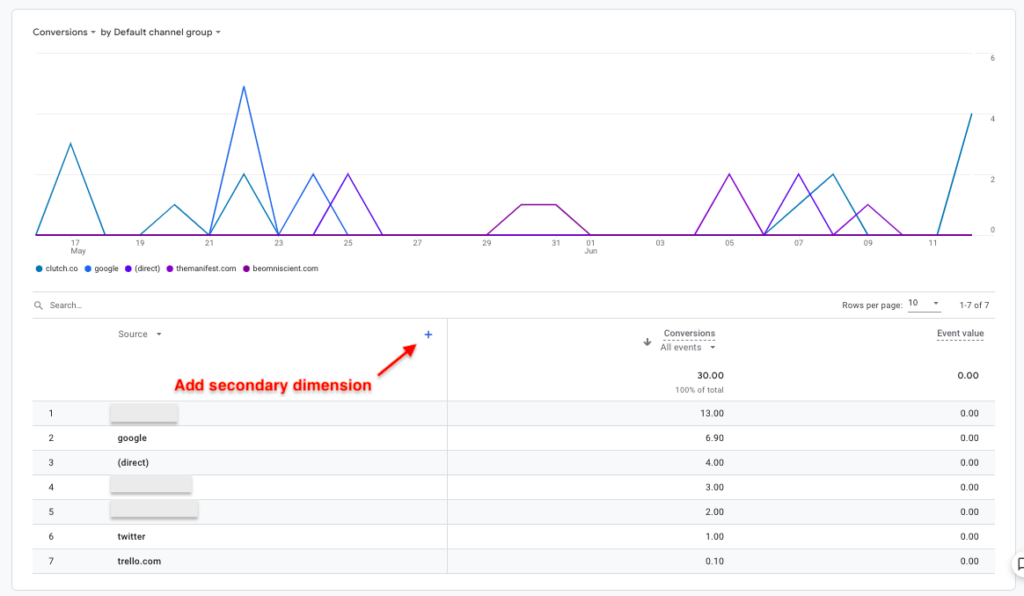
So, for example, you could filter for Source as your primary dimension and Medium as your secondary dimension to get a more granular view of where your conversions are coming from.
Or, you could filter for Landing page + query string as your secondary dimension to see which page + channel pairs are driving conversions — the second key question most businesses and marketers want to answer.
All in all, this report can provide a decent high-level view of your conversion volume and channel performance. However, keep in mind that this report uses the default attribution model from your attribution settings, which is automatically set to data-driven attribution unless you adjust that manually.
So, be aware that (a) the numbers reported may not be entirely accurate for the reasons we discussed above, and (b) it’s worth setting up additional reports with rules-based attribution models to build up a more complete picture of your conversion data.
The following two reports are what we’re using to track conversions for our clients.
Set Up the Model Comparison Tool (MCT) to Measure Last Touch Attribution
Historically at our agency we have leveraged the model comparison tool to measure first and last touch attribution (also known as First click and Last click). Doing so has allowed us to get a more holistic view of the way our SEO content contributes to our client’s conversion goals.
Last click would show conversions where our blog post was the landing page (i.e., the first page seen) of the session in which a website visitor converted (i.e., their “last” session before converting). First click would show conversions where our blog post was the first page viewed in a user’s first session — the page that brought the visitor to our client’s site in the first place (what content is supposed to do) — and where that user converted at some point later within the next 90 days.
While this was not a perfect measurement for a variety of reasons that we’ve explained previously, it was very good and provided a more holistic view of conversions compared to the UA’s landing pages report (what we saw most marketers using to measure conversions).
Compared to GA4’s data-driven attribution models, First and Last click rules-based models provide more concrete data that businesses can rely on. They’re not based on an algorithm in which we can’t exactly know how conversions are being counted. If you see a First click conversion, you can be confident that the channel (Google Ads, organic search, etc.) or page the report is listing brough in a user, and that user converted sometime int eh subsequent 90 days. If you see a Last click conversion, you know a user landed on your page and converted later in that very session. This is useful, concrete conversion data for a business. To measure this, we use the Model Comparison Tool.
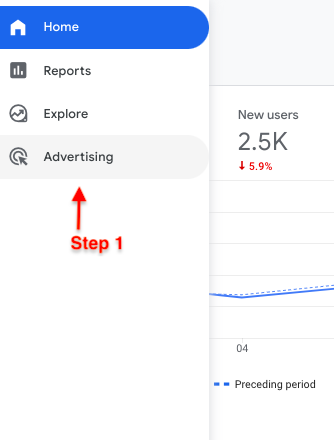
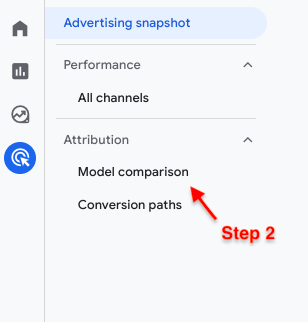
Here’s step by step instructions on how to set up the model comparison tool in GA4:
Step 1: Select Advertising from the menu in the left hand column.
Step 2: Under Attribution, select Model Comparison.
Step 3: Select the Conversion Events you want to filter for and click Apply.
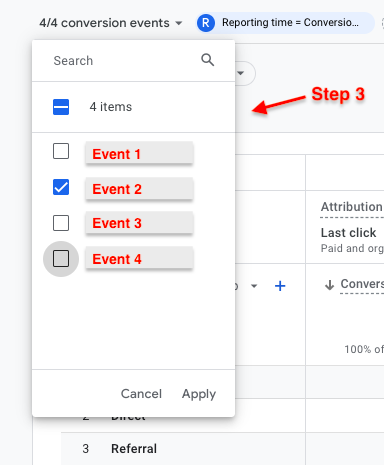
Note: By default, all conversion events will be selected. You need to uncheck whichever conversions you do not want to view in the report, and leave check marks for the events you want to view data for.
Step 4: Change the left column of the table to filter for Source / medium and Landing page + query string.
4.1. Select Default Channel Group at the top left of the report table.
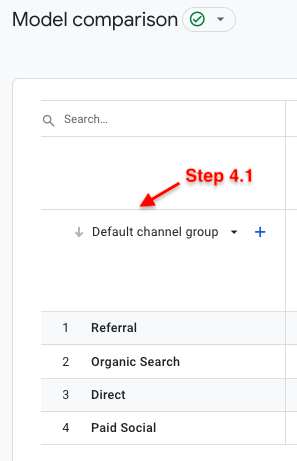
4.2. Set to Source / medium.
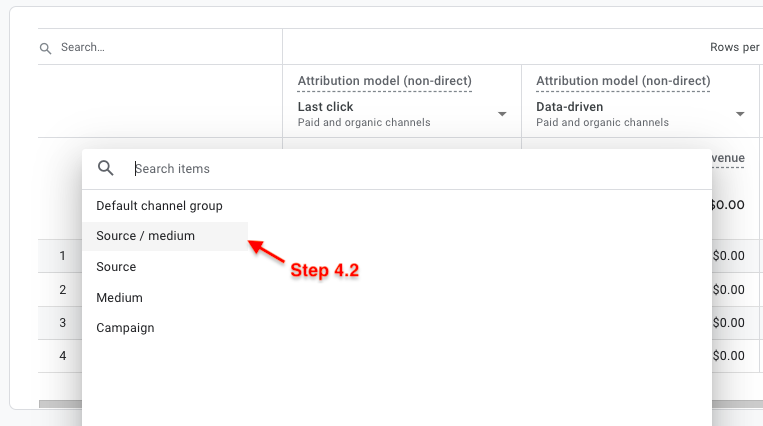
4.3. Click the plus sign next to Source / medium.
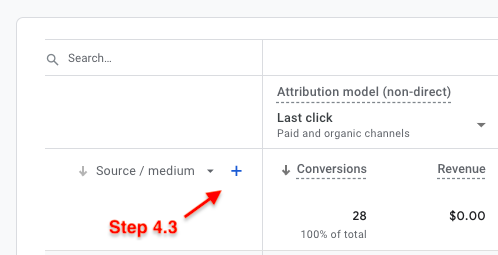
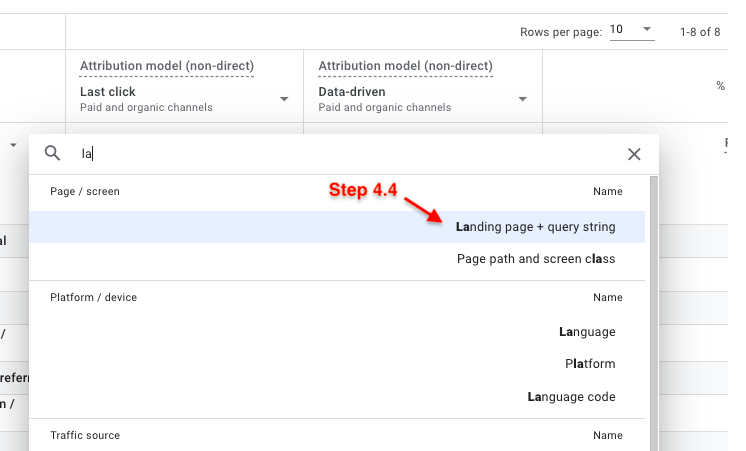
4.4. Search for and select Landing page + query string.
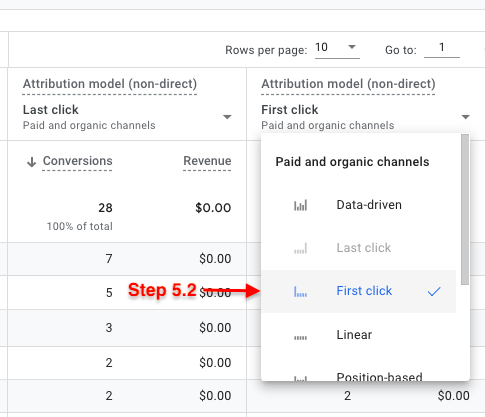
Step 5: Adjust the third column of the table, titled Attribution model (non-direct), to measure First click.
5.1. Click the dropdown arrow in the third column titled Attribution model (non-direct).
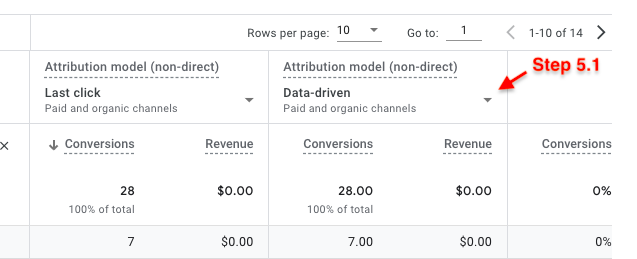
5.2. Select First click.
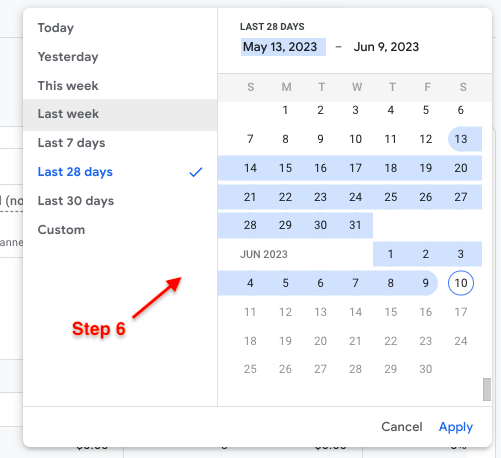
Step 6: Adjust the Date range to the time period you want to look at conversions for and click Apply.
Step 7: Add filters to look at your first and last click conversions in different ways, such as by page/screen, platform/device, or traffic source, among others.
7.1. Click Add filter +.
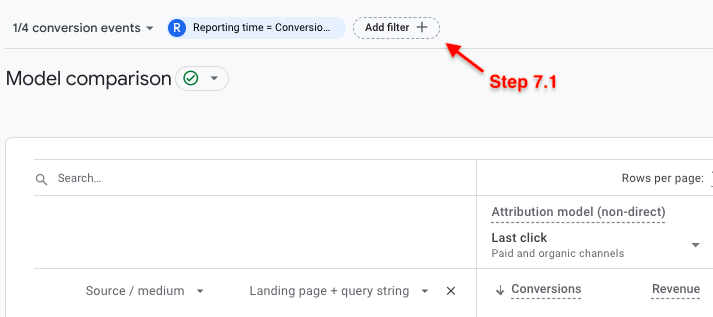
7.2. Select desired Dimension and Dimension values.
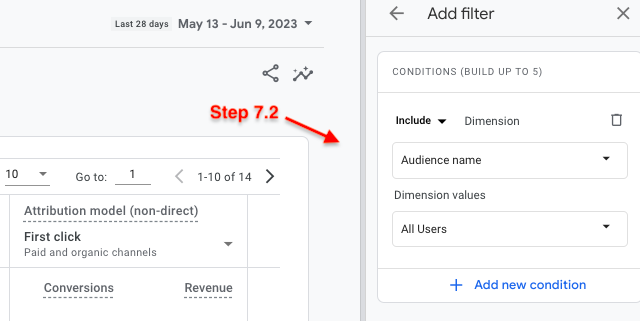
When using this report, we add a filter to view conversions that specifically came from blog posts we’ve created for our clients (excluding conversions from all other pages).
To do this, we add the Dimension: Landing page + query string, and then under Dimension values we individually select the URLs of our blog posts. URLs will appear in this value section once GA4 has indexed them. As far as we can tell, this usually occurs after a conversion has taken place. This step allows us to see and report on just the conversions our agency is contributing.
Step 8: Create a link to Share this report and make a copy of the Share Link.
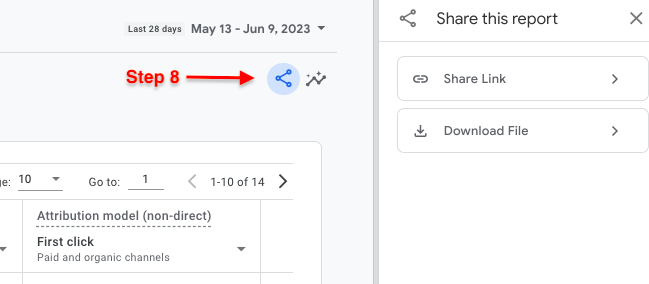
In the GA4 Model Comparison tool, there is not an option to click “Save” like you could in the UA MCT. So, to avoid needing to go through this process every time you want to see your data in this way, you can click the Share this report button, copy the link to this report, and use that link to access that report in the future.
Now, one key limitation of this Model Comparison report is that it will not attribute conversion credit for cases in which one of our blog posts was viewed at some point along a user’s journey, but not in the first or last session. This is another data point that’s useful, particularly in B2B contexts where multiple stakeholders are often viewing pages over periods of weeks or months prior to converting.
To measure these influenced conversions, where one of our blog posts was a landing page at some point along the path to conversion (which could include first click, last click, or any session in between), we’re using the Any Touchpoint Report, discussed next.
Note: In May of 2023, Google announced that they’d start sunsetting functionality for first click, linear, time decay, and position-based attribution models. We will continue using the MCT to measure Last Click conversions, and rely on the Any Touchpoint report to account for First Click, Last Click, and influenced conversions that happen along the conversion path.
Set Up an Any Touchpoint Report
This particular method fits our specific needs at our agency. Namely, the ability to measure influenced conversions just from the pages we’ve created for our clients. So, if you’re an agency, freelancer, or individual consultant that needs to report to clients as we do, the following report may be useful to you.
However, this can also be useful for in-house marketers or business owners that want to see, for example, how a particular part of their site such as their blog is contributing from a conversion perspective.
In essence, what we’re going to do is create a segment that includes users who landed on our blog posts and at some point later converted. Then we’re going to create a table of landing page URLs versus conversions for people in that segment so we can see how many conversions each landing page generated.
Here’s step by step instructions on how to set this up:
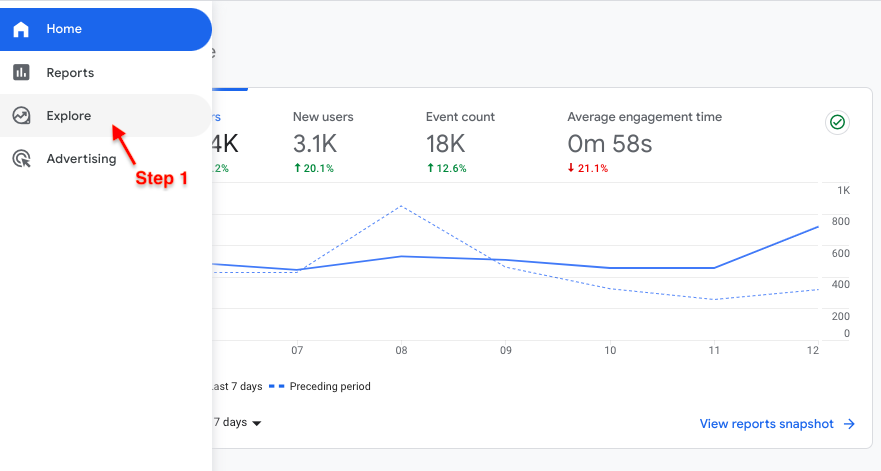
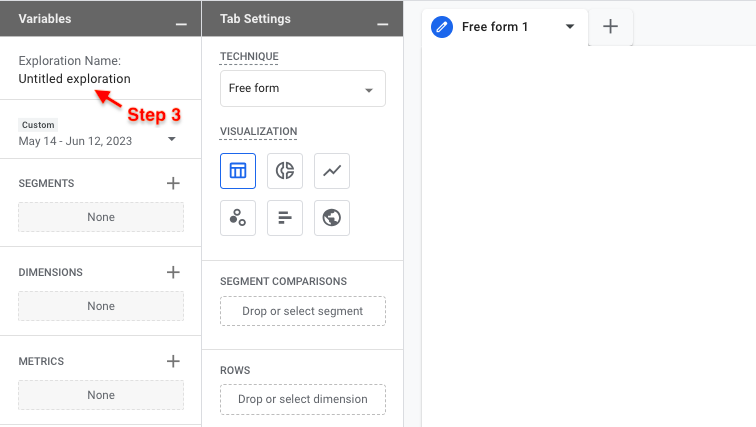
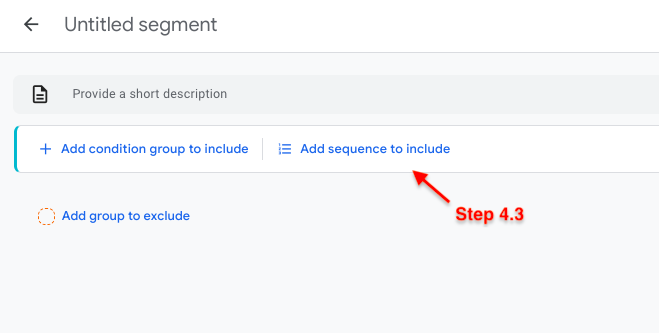
Step 1: Select Explore from the menu in the left hand column.
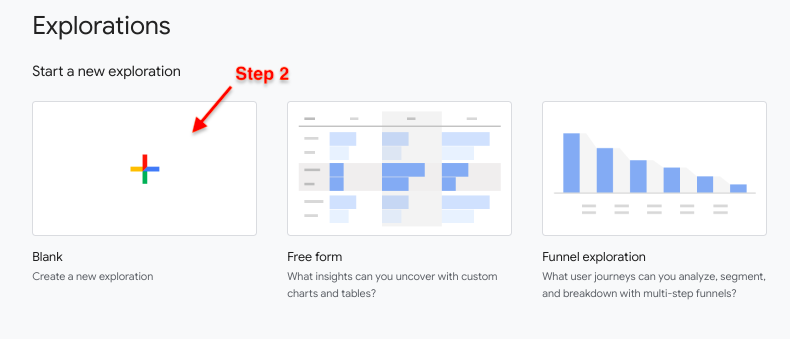
Step 2: Create a new Blank report.
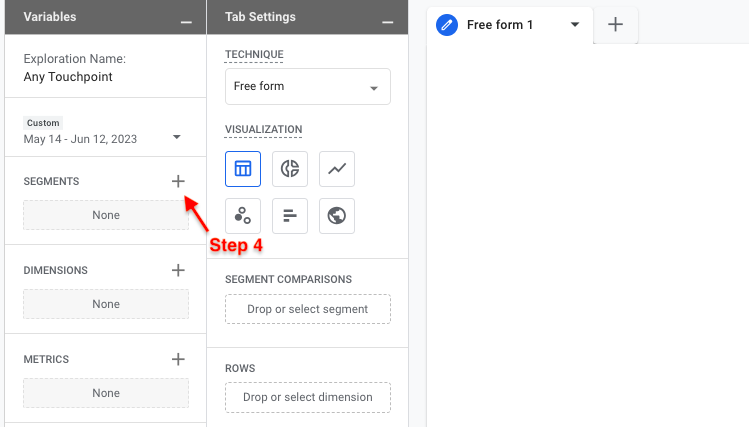
Step 3: Create a name for your report under Exploration Name.
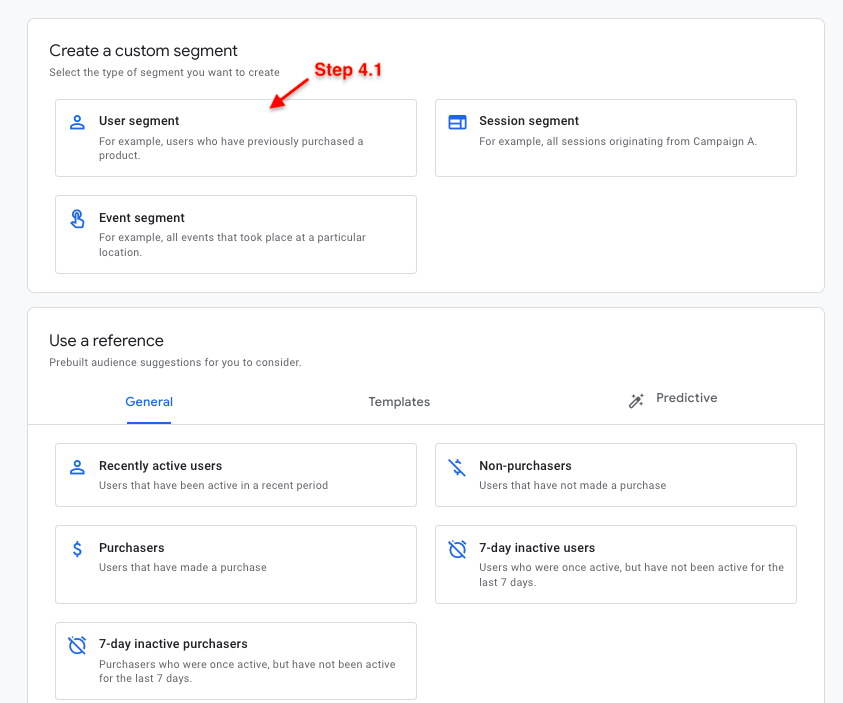
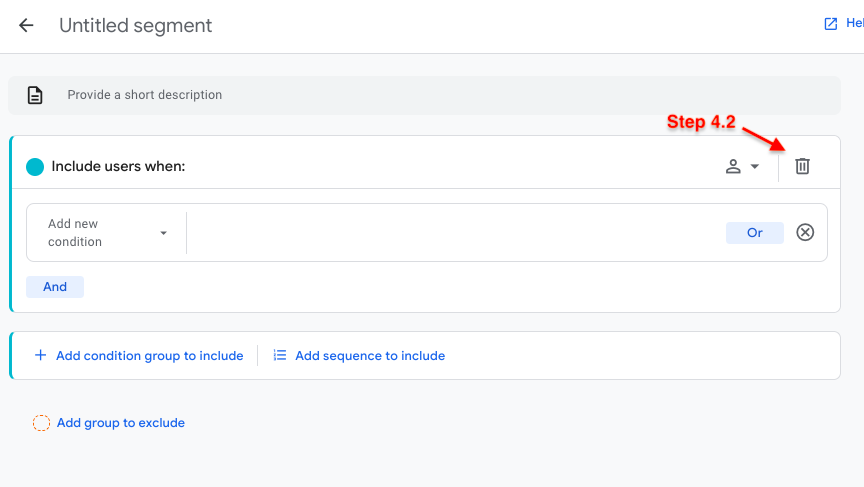
Step 4: Add and set up a Segment.
4.1. Select User segment.
4.2. Delete the Include users when module.
4.3. Select Add sequence to include.
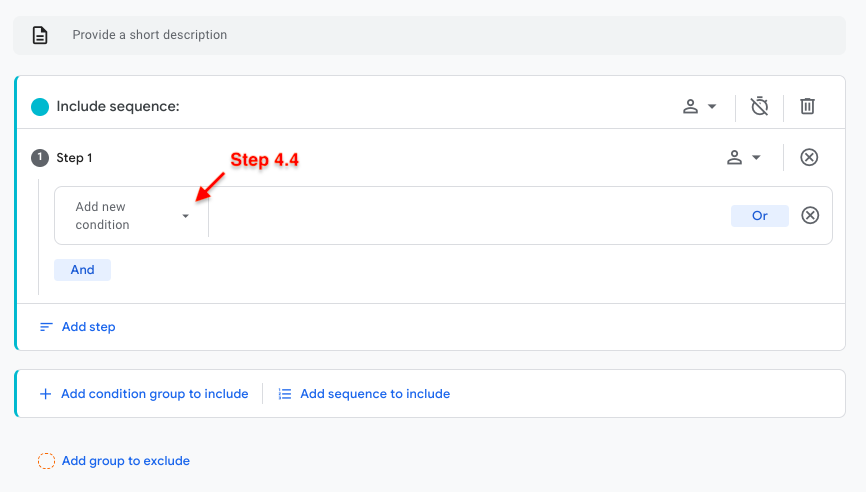
4.4. Select Add new condition.
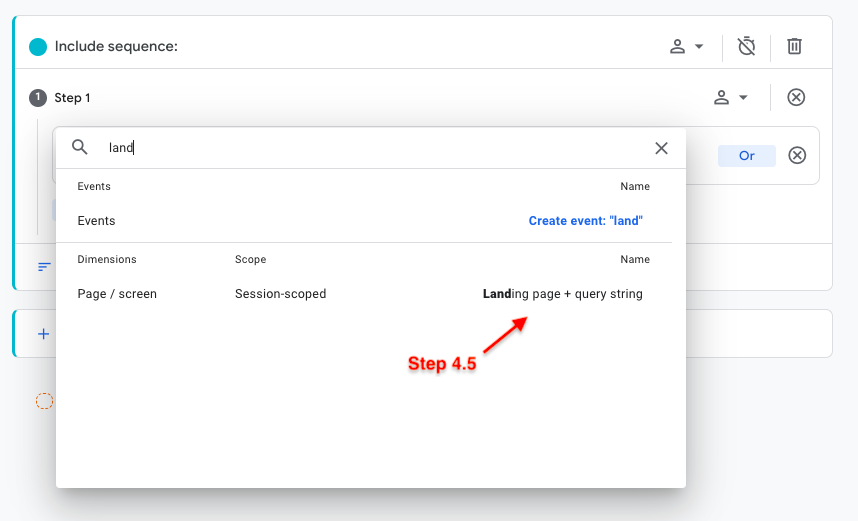
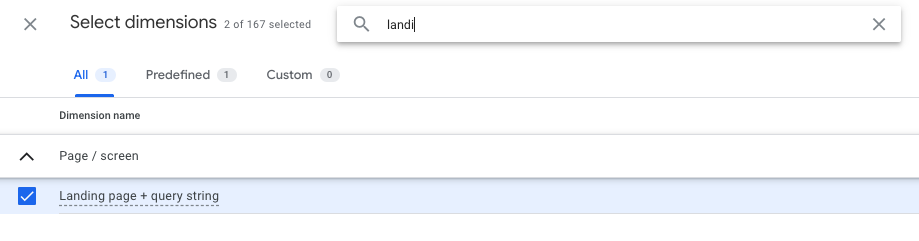
4.5. Search and select Landing page + query string from the dropdown menu.
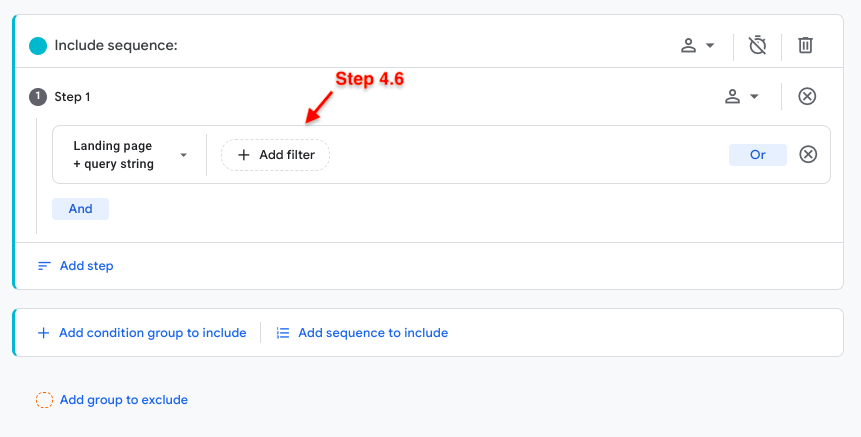
4.6. Select Add filter.
4.7. Select matches regex. (Not familiar with regex, i.e., “regular expression”? Learn more here.)
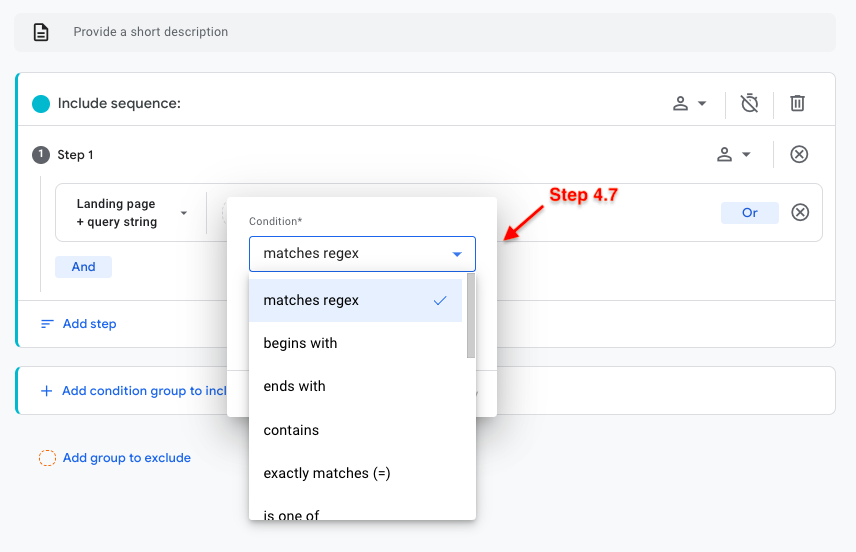
4.8. Paste your regex into the field provided and click Apply.
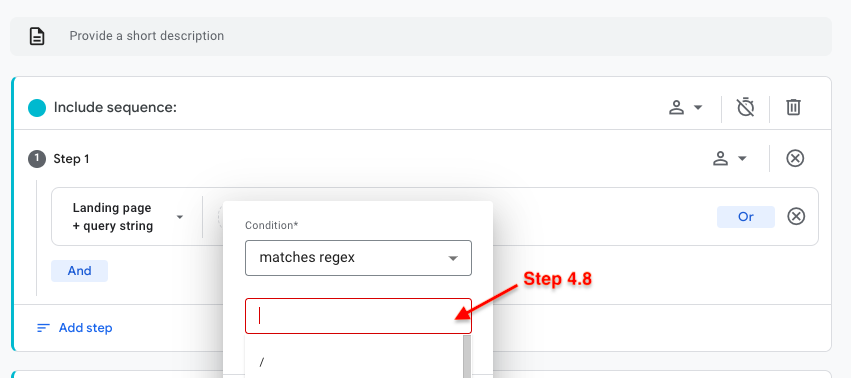
In our case, this is the regex of the set of URLs we want to measure (the URLS of each blog post we’ve created for a client).
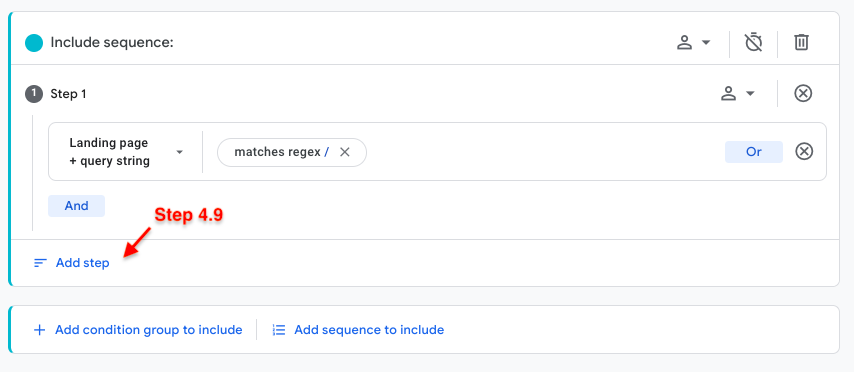
4.9. Select Add step to add a secondary step.
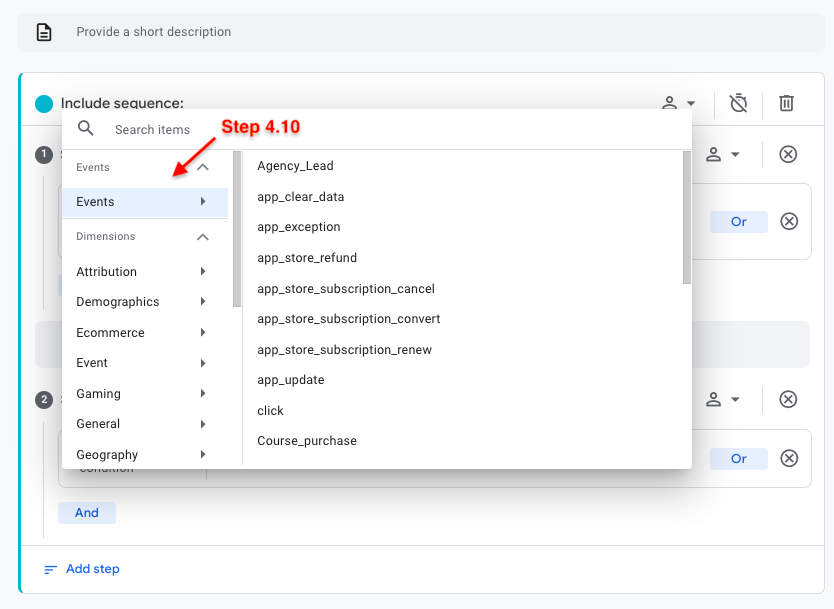
4.10. Select Add new condition and select the conversion event you want to track from the Events dropdown.
4.11. Name your segment and click Save and apply.
Step 5: Add the Dimensions you want to view in your report.
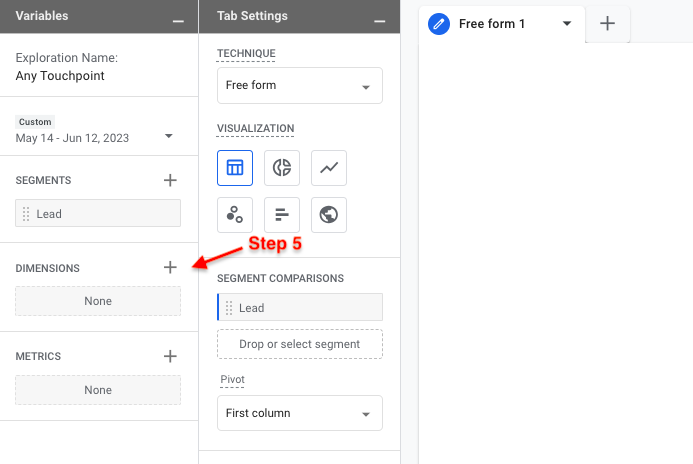
Similar to the reports we’ve covered above, here we use Landing page + query string, First user source / medium, and Session source / medium — all of which you can find by using the search bar at the top of the Dimensions module.
Once you’ve selected your dimensions, click Import.
Step 6: Add the Metrics you want to view in your report.
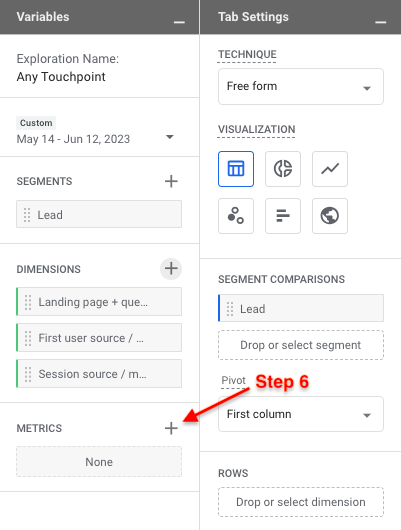
Here we use Total users and Conversions, both of which you can select from the Metrics menu.
Once this is complete, you’re done setting up your report Variables, and you can begin defining your Tab Settings which determine which dimensions and metrics become visible in your report table to the right.
Step 7: Add your Dimensions and Metrics to your Tab Settings.
7.1. Double click Landing page + query string, First user source / medium, and Session source / medium (or drag and drop each to Rows section).
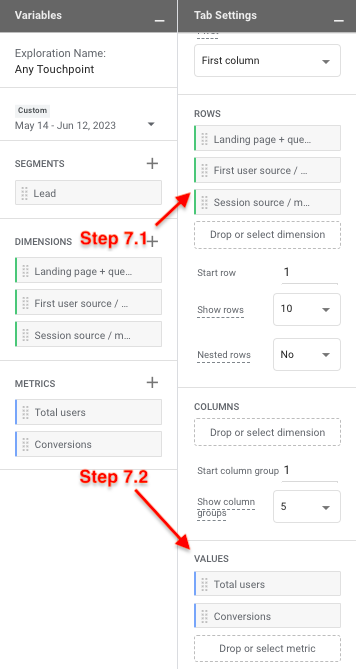
7.2. Double click Total Users and Conversions (or drag and drop them to the Values section).
At this point, you’ll now have a table to the right that displays your conversion data based on these dimensions and metrics.
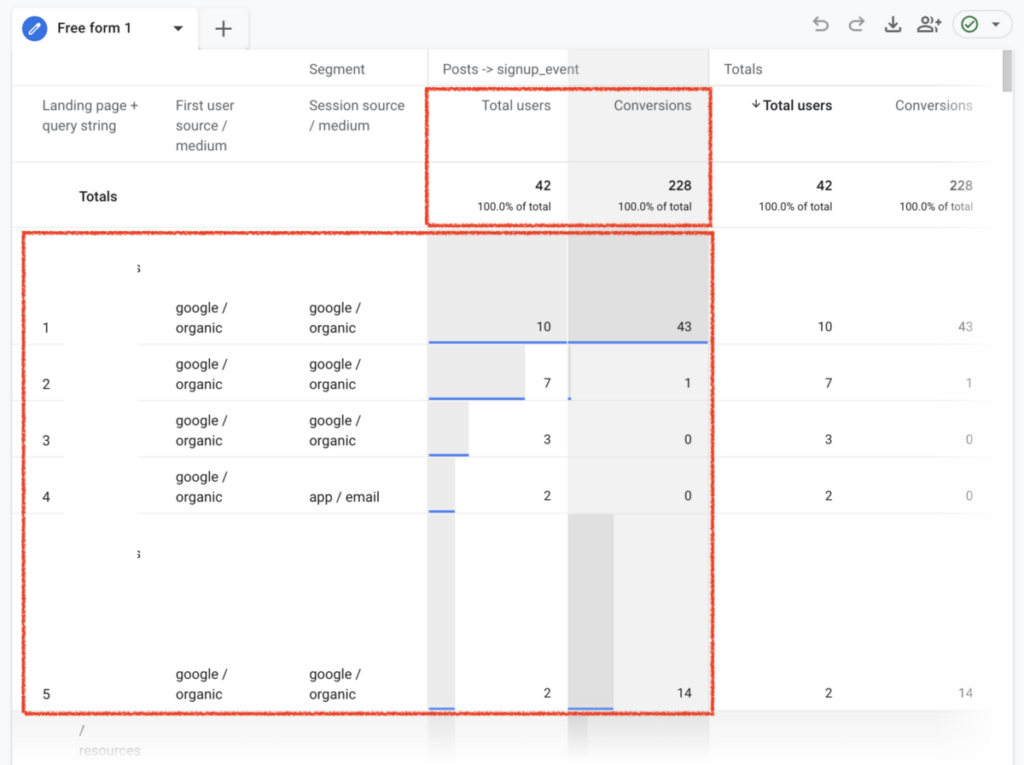
Interpreting this table can be a little tricky, so let’s walk through it carefully:
What’s most important to understanding this table is to separate the total numbers from the table below it, that’s why we’ve boxed them separately above.
Let’s understand the totals first (smaller rectangle in above image).
- Understanding the Total users metric: The number shown at the top of the Total users column is arguably the most important number in this entire table because it tells the number of users who fulfill your segment conditions for the date range you’ve selected. In other words, that’s the number of people who converted after landing on whatever pages you specified in your segment. In the example screenshotted above, we created a segment for people who, (1) started a session on one of the blog posts we created for our client, and, (2) signed up for their SaaS product. So, in this case, 42 users met this segment criteria in our date range.
- Understanding the Conversions metric: The number shown at the top of the Conversions column tells you the number of times that users who satisfy your segment conditions triggered a conversion event. So, in the example above, there were 228 conversion events triggered by the 42 users that met our segment criteria for the selected date range.
Note: The reason the number of conversion events is so much higher than the number of total users is because this metric shows data for any conversion event that was completed by those users, not just the conversion event that we defined in our segment. As we mentioned earlier, GA4 automatically has conversion events turned on for small actions such as page views, scrolls, etc. — so if you haven’t turned these off, this conversion number will inflate to include those conversion events as well. Bottom line: whichever conversion events you have switched on in your conversion settings will be included here, so if you want to be more focused on a particular conversion event or subset of conversion events, you should make sure that those are the only conversion events switched on in your settings. You can turn these on or off by going to Admin (the gear icon on the bottom left), then Events under the Property column.
Now, what about the table underneath? The best way to understand this table is to think of it as a list of all the landing pages in all the sessions from the users in your segment… because that’s literally what it is. It’s not a list of only the URLs you listed in your segment. It’s just listing any and all landing pages that the users who fulfilled your segment conditions visited and counting the number of users who landed on each URL and the number of conversion events that those users triggered in those sessions.
If you add up the number of users in each row of your table it’ll almost always add up to be larger than the total number of users because naturally most users have more than one session.
So, let’s tie this all together with a plain English interpretation of the first row of the table, including the secondary dimensions of First user source / medium and Session source / medium. The first row tells us that:
- 10 users happened to have sessions where the landing page was that first row’s URL (which we’ve redacted for client privacy) and they came from google/organic in that session and in their very first session.
- During those sessions, those 10 users triggered 34 conversion events (which could include the conversion event we were measuring in our segment, in addition to other conversion events that our client has switched on in their settings).
So, how do we use this to help understand what content brought in the conversions? We’re still getting used to this, but how we’re using it now is to scan the table for our blog URLs. Because when you see a URL of interest in this table and it has conversions in that row — in particular if your conversion events are limited to really important conversions of interest, then that row is showing you the number of “last click” or “same session” conversions that that URL generated in your date range.
In the case of the first row of the above table, we are ranking in position #1 of organic search for a high buying intent “app” keyword. So, this row is telling us that 10 of our 42 users landed on that blog post from Google and had some conversions in those very sessions. This client has a ton of events defined as conversions (hence 43 conversions in that row) so we can’t tell much about the conversions that happened in those sessions (except that there were 43 of them), but if we had limited the conversions to just “app signups” for example, we could have seen how many signups those sessions to our blog post generated.
And, that’s a key detail about how to make this table more useful: if you want to be precise about defining a conversion as a single event, such as a trial or demo signup, you should make sure that is the only event toggled on in your conversion settings. Then, you can be sure that the conversion events being shown in the Conversions column correspond with the exact same conversion event that you defined in your segment.
Note: You can adjust the date range to view conversion data over different time periods. And unlike the MCT, this report will automatically save when you exit back to the Exploration reports page, where you can come back to access your report.
If this all sounds difficult and complicated, we get it, we’ve lived through it to get to this point and be able to create these reports and understand them. To help, we’re offering a unique mini-service of helping companies setup conversion tracking in GA4 and teaching their team how to use the generate and interpret the reports above. If you’re interested, you can read about it and reach out here.
Learn More About Our Agency
- SEO and Content Marketing Service: If you want to hire us to execute a content-focused SEO strategy built around driving lead generation and sales, not just traffic, you can learn more about working with us here.
- Our GA4 conversion setup service: We get that executing the steps outlined above and then understanding what the reports mean is not easy. To help, we’re offering a unique mini-service of helping companies setup conversion tracking in GA4 and teaching their team how to use the generate and interpret the reports above.
- Paid Search Service: We started PPC services at Grow and Convert after seeing thousands of dollars of wasted spend in our client’s Google Ads accounts (full story). Specifically, we noticed that many paid search agencies focus their strategy around maximizing clicks and traffic and rely heavily on Google’s automation tools. In contrast, we applied our well honed bottom of funnel strategy from SEO to paid search, where we take an active, manual approach to ensuring every campaign maximizes lead generation instead of click generation.
- Join Our Content Marketing Team: If you’re a content marketer or writer and would love to do content marketing in this way, we’d love to have you apply to join our team.
- Our Content Marketing Course: Individuals looking to learn our agency’s content strategy and become better marketers, consultants, or business owners can join our private course and community, taught via case studies, and presented in both written and video content formats. We include several details and examples not found on this blog. Our course is also built into a community, so people ask questions, start discussions, and share their work in the lesson pages themselves, and we, along with other members, give feedback. Learn more here.
- Continue Learning: Find additional content on our blog and YouTube channel.
Join the Grow and Convert Newsletter
Get our marketing ideas emailed weekly.
Explore Articles By Categories


Explore our Videos