[su_note] Note: With the sunsetting of Universal Analytics (UA) and the introduction of Google Analytics 4 (GA4), the content below on how to set up the Model Comparison Tool to measure conversions in GA is now outdated. We’ve written a new step by step tutorial on how to set up conversion tracking in GA4 which you can read here. [/su_note]
Back in the day, we wrote this post on an “extremely simple way” to attribute leads (or sales, or “conversions”, depending on your business model) to content marketing.
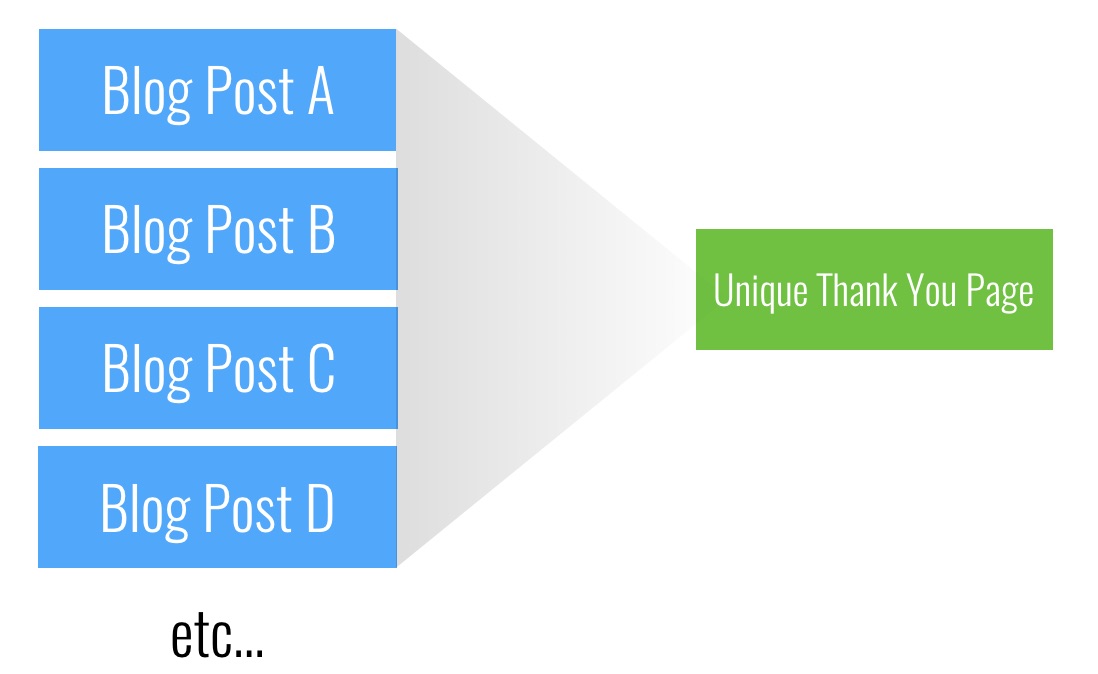
It outlines a simple way to set up goals in Google Analytics to track visits to unique thank you pages that are only accessible by signing up.
Then, it outlines a series of built in reports in GA that can help you understand conversion rates from different angles.
I still think 75% of businesses doing content marketing could use it to calculate their content marketing ROI and benefit from it.
From my anecdotal evidence, most businesses just aren’t measuring conversion rates at all. They just don’t care.
Aside: If you meet Benji in person, ask him why he thinks that is. He has an interesting argument about that being related to mis-aligned incentives between content marketers and the company (CEO, etc.). Specifically, getting leads from content is hard. It’s harder than just getting traffic. So it’s not in the content marketers interest to set this up or report on it. They’d rather focus on vanity metrics, such as whether they’re publishing “on time”, which of course, from the company’s perspective is a nonsensical metric.
But for those of you that do care about measuring conversions, this article is going to outline a more advanced (and more accurate) way of measuring lead generation or conversion rates from content.
This method accounts for the fact that most blog readers don’t convert on their first encounter with a post. They may convert later that day, a few days later, or months later, so you’ll need to be able to account for that.
We’ll also discuss how we think about multi-touch attribution models in general, that is, how do you attribute a conversion if a user touches multiple pages or parts of your business before they convert (and a blog post is only one of those touch points).
It turns out Google Analytics has built in reports that can answer these questions.
Finally, we’ll look at examples of actual conversion numbers from different types of companies and see how they compare using different attribution models.
Note: If you’d like to learn how to attribute leads to content with video examples, we also share this process and more, in our course and community.
Why First Click Attribution is Important for Measuring the Value of Content Marketing
In working with companies over the past few years, we’ve noticed that companies have varying ways that they measure the ROI from their content marketing efforts.
To be fair to both marketing teams and company executives, it is very difficult to measure the exact ROI of content marketing.
We like to say that the reports we share below are a lower limit of the ROI your company is receiving from content – ie. the lowest numbers of leads we can report on.
This is because it’s hard to measure the effects that content has on brand, word of mouth, branded search, and other things that affect the customer journey. So the number of leads your content produces is usually much higher than what any marketer can actually report on.
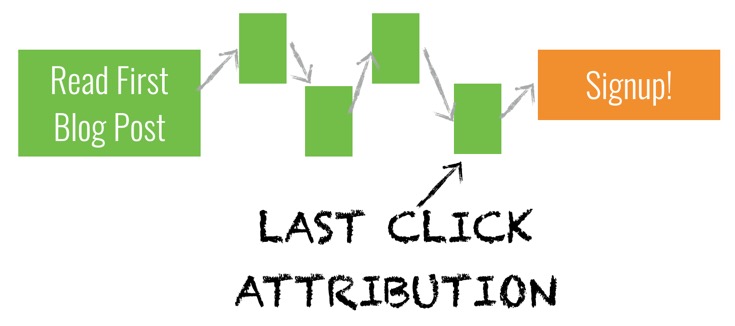
Let’s look at last click versus first click content attribution briefly to understand this better.
Last Click Attribution: A Really Low Estimate
Last-click attribution (also known as last-touch attribution), for our purposes, measures a user converting in the same session as landing on the page. It is what most companies use to measure their performance.
In Google Analytics, this is typically done by looking at goal conversion percentage in the landing page report (as outlined in our previous blog conversion article).
But this isn’t great for measuring ROI from content marketing because it doesn’t align with the buyer’s journey. It’s rare that someone would read one piece of content — especially if it’s top or middle of the funnel — and then convert in the same session.
If you’re measuring success only by last click attribution, then you likely have a warped view about what’s working from a content marketing perspective. There are likely only a few posts on your site that are driving “leads” or “conversions” from a user’s last touchpoint. Or in many cases, there may be none at all.
To get a better picture, you have to look at first click attribution in addition to their last touch.
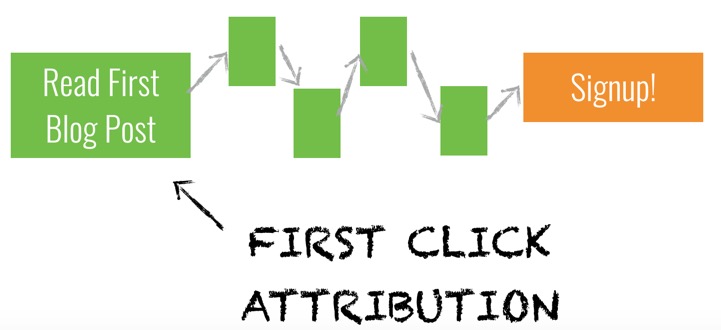
First-Click Attribution: A Better Measure of Content Conversions
First-click attribution (also called first-touch attribution) means a conversion is attributed to the first interaction a user has with your site. It gets us closer to measuring success from how a customer would interact with your content.
In large part, most of the content you create is at the top or middle of the funnel. Thus, content fits in the awareness stage of the buyer’s journey.
A prospect might find out about your company from reading a piece of content, and come back at a later point to convert. If you were just measuring success by last-click attribution, you’d never know that your content influenced the conversion.
First-click attribution gives us a broader picture of how content plays a role in acquisition.
Let’s take a look at how to measure first-click attribution in analytics and some examples of how this helps us measure success below.
What the Model Comparison Tool in Google Analytics Let’s You See (That You Can’t See Now)
You can get last click conversion numbers in Google’s Landing Pages report (full article), but to get first click (and other) conversion stats, you’ll need to use GA’s Model Comparison Tool.
With that tool, you can do some advanced ninja conversion analysis like this:
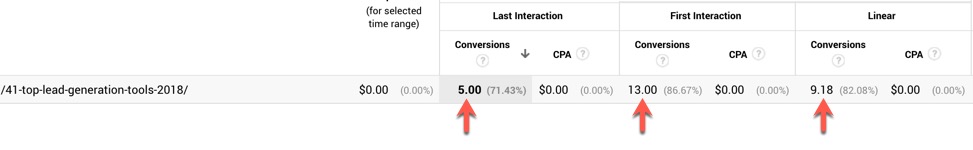
This is showing three different numbers for leads generated from a particular blog post.
- Last Interaction: means 5 users converted in the exact same session where they landed on this post. So it was the “last interaction” before they signed up.
- First Interaction: means in a 90 day window (we can adjust this to look from 0 to 90 days), there were 13 conversions for which this blog post was the first time the converting user landed on the site.
- Linear: means that for each conversion where this blog post was one of the touchpoints, it got equal credit as all the other touchpoints. So, if the converting user came to the site 4 times, and the blog post was one of those times, it got 0.25 of a conversion attributed to it. That’s why this linear attribution model can have decimal values.
Think about how much of a better understanding you can have about how your content plays into conversions for your business with this tool.
Namely, you can answer this question:
Are people signing up immediately or are they coming back multiple times and signing up later? And you can do this on a post by post basis.
With this report, you can answer which posts are converting versus which aren’t, so you can think through what type of content you should be focusing on in the future.
In the example above, there are 8 extra conversions in the first click model. That means more than double the people that sign up immediately (5) are signing up in a later session.
You can get even more ninja by combining this with the “Time Lag” report that shows you how many days it typically takes people to convert:
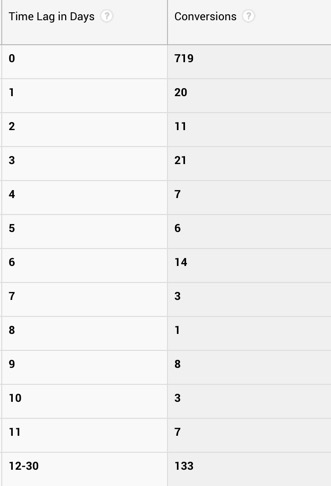
Looks like the majority, above, sign up in a couple of days but there are also a decent number that wait over 2 weeks.
And the “Path Length” report shows how many interactions with the site it typically takes for someone to convert:
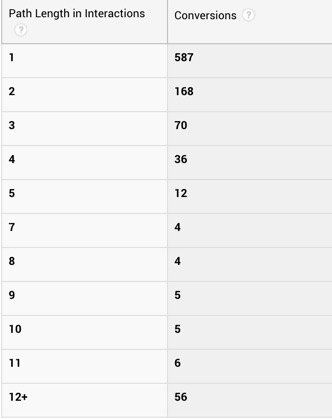
Being able to navigate these reports isn’t hard, and in my opinion, successfully utilizing this information will make you a better marketer.
How to Set Up the Model Comparison Tool to Get Multi-Touch Conversion Numbers
First things first, make sure you have Google Analytics (GA) goals set up to track some conversion metrics, whether that be contact us form fills, trial signups, email opt-ins, or whatever. Again, the post I referenced above explains how.
We also did a 45 minute webinar sharing how to set up goals and use this to measure leads from content.
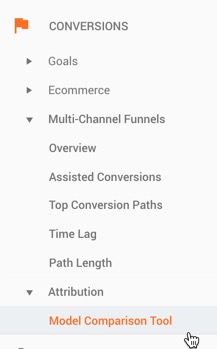
The model comparison tool lives in Conversions > Attribution.
First, pick the goal you want to analyze on the top left:
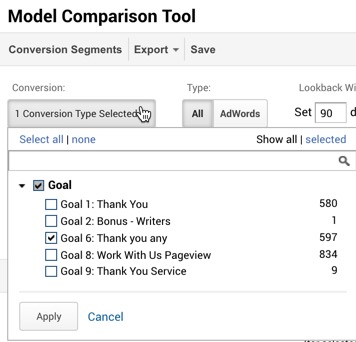
It rarely makes sense to keep all goals highlighted. Pick one and analyze that.
Next set your “Lookback Window”.
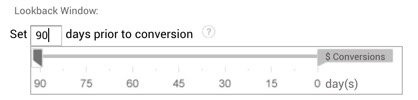
This represents how far back GA will look when computing the first click number. So “30 days” means for a conversion that happened in the date window you had set, it’ll look 30 days back to see what was the first touchpoint for that user.
We see no reason not to max this out at 90 days.
Next pick your attribution models (this is why it’s called the model comparison tool).

This part is up to you, but we always compare First, Last, and Linear, because those are the most telling in terms of how content leads to conversions. (Honestly, you could just stop at First and Last and you’d be fine.)
First and Last tell you about the extremes:
- First: How many people landed on a blog post first, then eventually convert?
- Last: How many people landed on a blog post, and convert in that same session?
Linear then gives you a look into what the conversion number would be if you included middle interactions.
Note: The conversion numbers are not additive. You don’t add first click and last click. They are just different models by which you can get a single conversion number.
Read the data this way: “If I count only last click conversions, what would the number be?” “If I count only first click conversions, what would the number be?”
Finally, set the Primary Dimension to be “Landing Page URL”.
To do that, click on “other” on the far right and search for “Landing Page URL”.

Note: You can do this same analysis across other dimensions, like acquisition channels. So you could see, for example, how many conversions are attributable to social media, direct, organic, and paid traffic depending on first, last, and other attribution models.
That’s largely it.
Now, you can filter the landing pages down to your blog posts. If your URL’s have “blog” in it, just type blog into the search field, or search for a particular post by its URL.
Examples of Conversion Data for Blog Posts from Different Companies
First vs. Last Example #1: Email Opt-ins to a Blog
Here’s an example of 5 posts where we’re looking at first and last click conversions for the goal of signing up for our email list:
What do you notice?
The numbers are almost the same. First click is slightly higher for some posts, but barely. That means the majority of conversions to our email list happen on the same session they land on a post.
That actually makes sense.
Most people make a decision to join a blog’s email list immediately, they don’t need to think about it or talk to their boss and come back later.
How does this affect your content marketing strategy? If you’re looking for email opt-ins, you’ll want to set up conversion CTA’s like content upgrades to get people to opt-in immediately. Don’t count on anyone coming back multiple times before opting in.
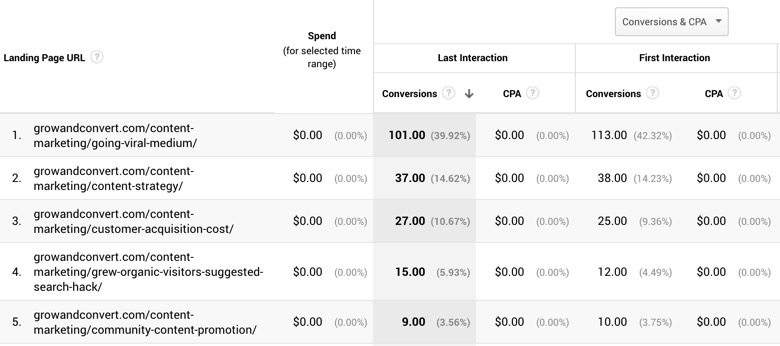
First vs. Last Example #2: Sales Form Fills for a High Value B2B Service
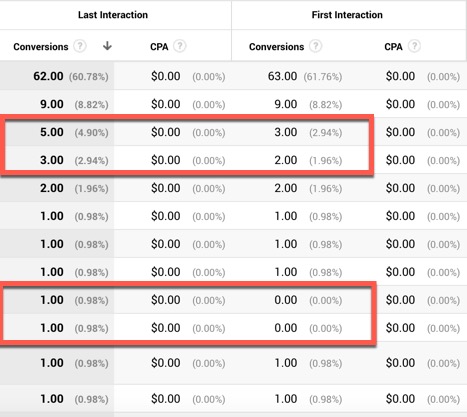
In contrast, look at form fills for our content marketing service in our “Work with Us” page:
There are multiple posts where someone read it, and came back in a later session and filled out our work with us form.
That makes sense for a high priced B2B service. People need time to think about it and make that decision. The “Lookback Window” is set to 90 days, so perhaps some people even had to discuss with others at their company and come back over a month later to fill out our form.
But this is not true for every agency!
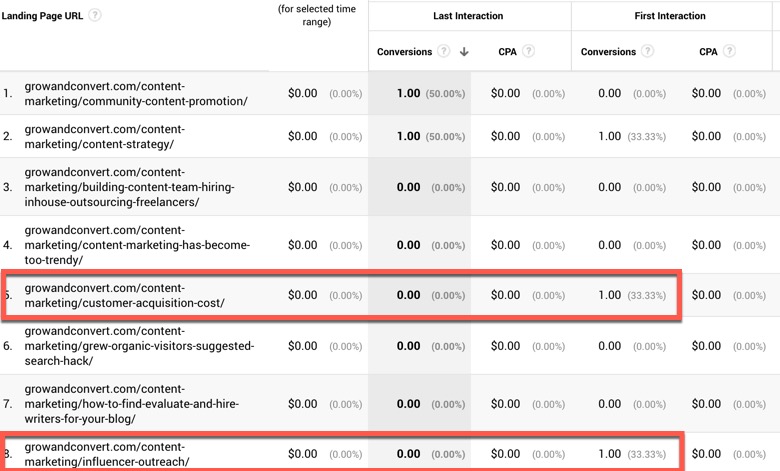
That’s why it’s important you analyze this yourself. Look at the conversions from various blog posts for one of our agency clients:
There are multiple blog posts for which there are more last click conversion than first. But no blog posts where there are the opposite (ignore the first line, which is their homepage).
What does that mean?
It means that for whatever reason, most people tend to signup to talk to them about working together in the same session where they are reading a post. And for the four posts highlighted above, those people first landed somewhere else (could be another blog post, but we don’t know).
This affects your content strategy in that you may want to focus on writing bottom of the funnel posts that qualify and attract hot prospects, as you know they are willing to fill out the contact form immediately upon reading the post.
First vs. Last Example #3: SaaS Free Trial Conversions
Here are first vs. last click conversions for one of our SaaS clients.
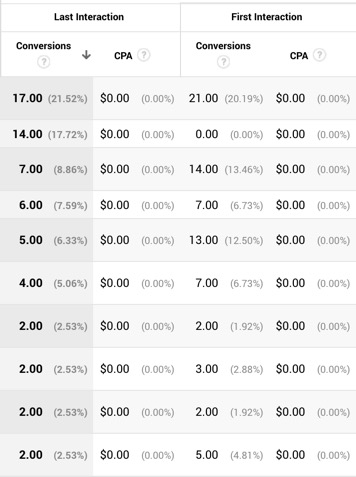
You can see it’s sort of a mix. There are certainly a lot of last click sign ups, but there are also several posts where there are a lot more (sometimes double) the signups when you use a first click model.
That’s expected for a self-serve SaaS free trial sign up. It’s not as flippant of a decision of “should I join this email list” but it’s not as involved of a decision as “should I contact this agency about working with them?”
Limitations of All Attribution Models (Including First Click!)
I hope the examples showed how important it is to measure content marketing conversions with more than just last click attribution, and how first click attribution can give a more accurate picture.
But even first click attribution has its limitations.
You will still underestimate lead generation from content marketing. Here’s why:
Limitation 1: Cross Device
How does GA know that you came to a site 2 months ago and converted today? It knows by putting a cookie in your browser. When you come back to a site, even if you close your browser, and weeks or months pass, the cookie tells GA, “Hey, it’s that user again.” That’s how the first click report above works.
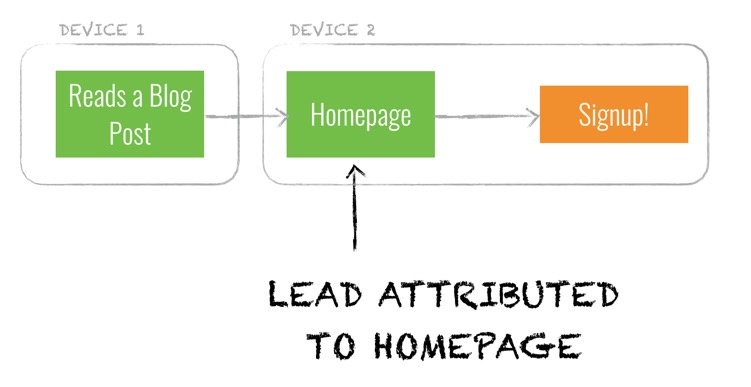
But GA won’t be able to track a converting user in this scenario:
- User reads a blog post on their phone
- User likes your company
- User gets to work
- User goes to your homepage and fills in a form, starts a trial, or in some way converts
They used two separate devices! GA’s cookie has no idea that phone session and that desktop session were from the same user.
So what landing page will the conversion above be attributed to? You guessed it, the homepage.
This is one of the reasons why if you do enough content marketing, you’ll see a ton of conversions from the homepage.
Limitation #2: Time Gaps Greater than 90 Days
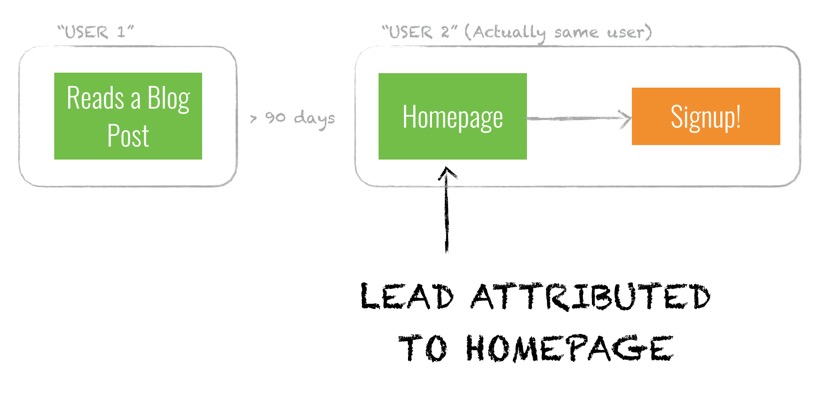
If you’re using GA, you’ll notice above the “Lookback Window” maxes out at 90 days. That means anyone who visits your site from a blog post and converts more than 90 days later will not be attributed to that blog post. Again, when they come back to sign up, where are they likely to land?
You guessed it, the homepage.
We personally experience this all the time. In every sales call we start by asking “How did you hear about us?” Many have said “I’ve been following you guys since the beginning” or “I joined your email list a year ago”.
If we looked at our “work with us thank you page” goal, we’d likely see the conversion attributed to our homepage, or whatever our most recent post is, but that’s wrong.
Limitation #3: Word of Mouth & Colleagues
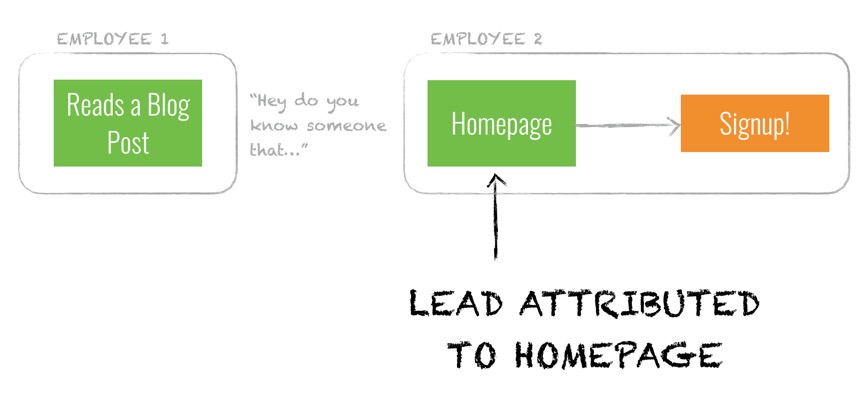
Finally, GA obviously won’t be able to know if Employee #1 reads your content, mentions it to their boss or Employee #2, and Employee #2 signs up.
It also won’t know if someone asks “Hey, do you know of a good mobile development agency?” and their friend responds “Yeah, have you checked out [your company here], I read one of their blog posts a while back and they really know what they’re talking about.”
We tell our clients this all the time: These limitations mean you won’t ever really know how many leads are generated by content, but you can get a lower limit.
Last click attribution is the worst lower limit. If you’re running content for a company and you report on last click conversions, you’re doing yourself a huge disservice and you won’t get the credit you deserve.
First click is a lot better and will catch a lot more conversions.
But in the end, even that is a lower limit. You’ll want to monitor overall conversions including generic pages like the homepage, and see that that’s headed upwards as well. And if you’ve been killing it with content for yourself, your client, or your employers, go ahead and take some credit for those.
Just tell them Devesh and Benji said it was okay.
Note: If you’d like to learn how to attribute leads to content with video examples, we also share this process and more, in our course and community.
Join the Grow and Convert Newsletter
Get our marketing ideas emailed weekly.
Explore Articles By Categories


Explore our Videos